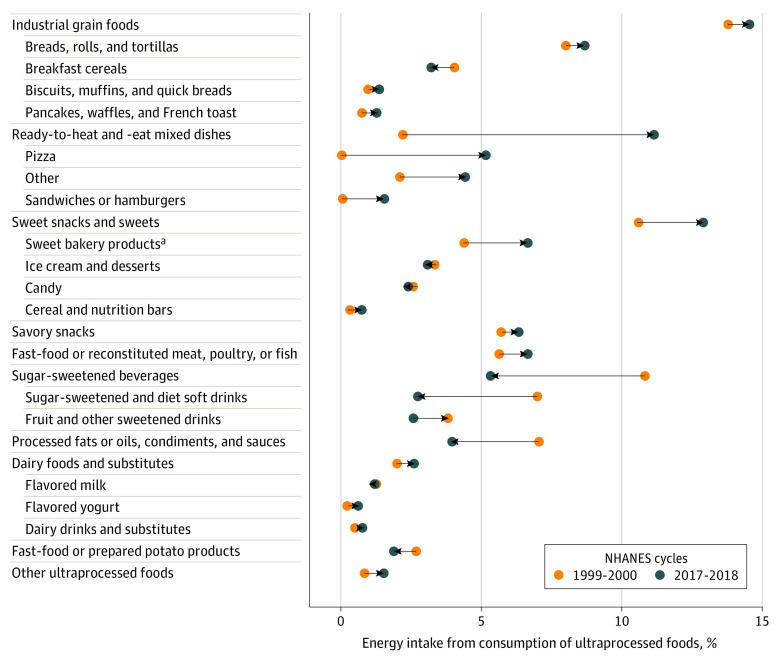
Figure 1. Changes in Estimated Percentage of Energy Intake From Consumption of Subgroups of Ultraprocessed Foods Among US Youths.
Based on dietary data of US youths aged 2-19 years collected in the National Health and Nutrition Examination Survey (NHANES) from 1999-2000 to 2017-2018. Arrows pointing to the right indicate an increase in consumption over time (eg, ready-to-heat and -eat mixed dishes) and arrows pointing to the left indicate a decrease in consumption over time (eg, sugar-sweetened beverages).
aIncluded cakes, cookies, pies, and pastries.

