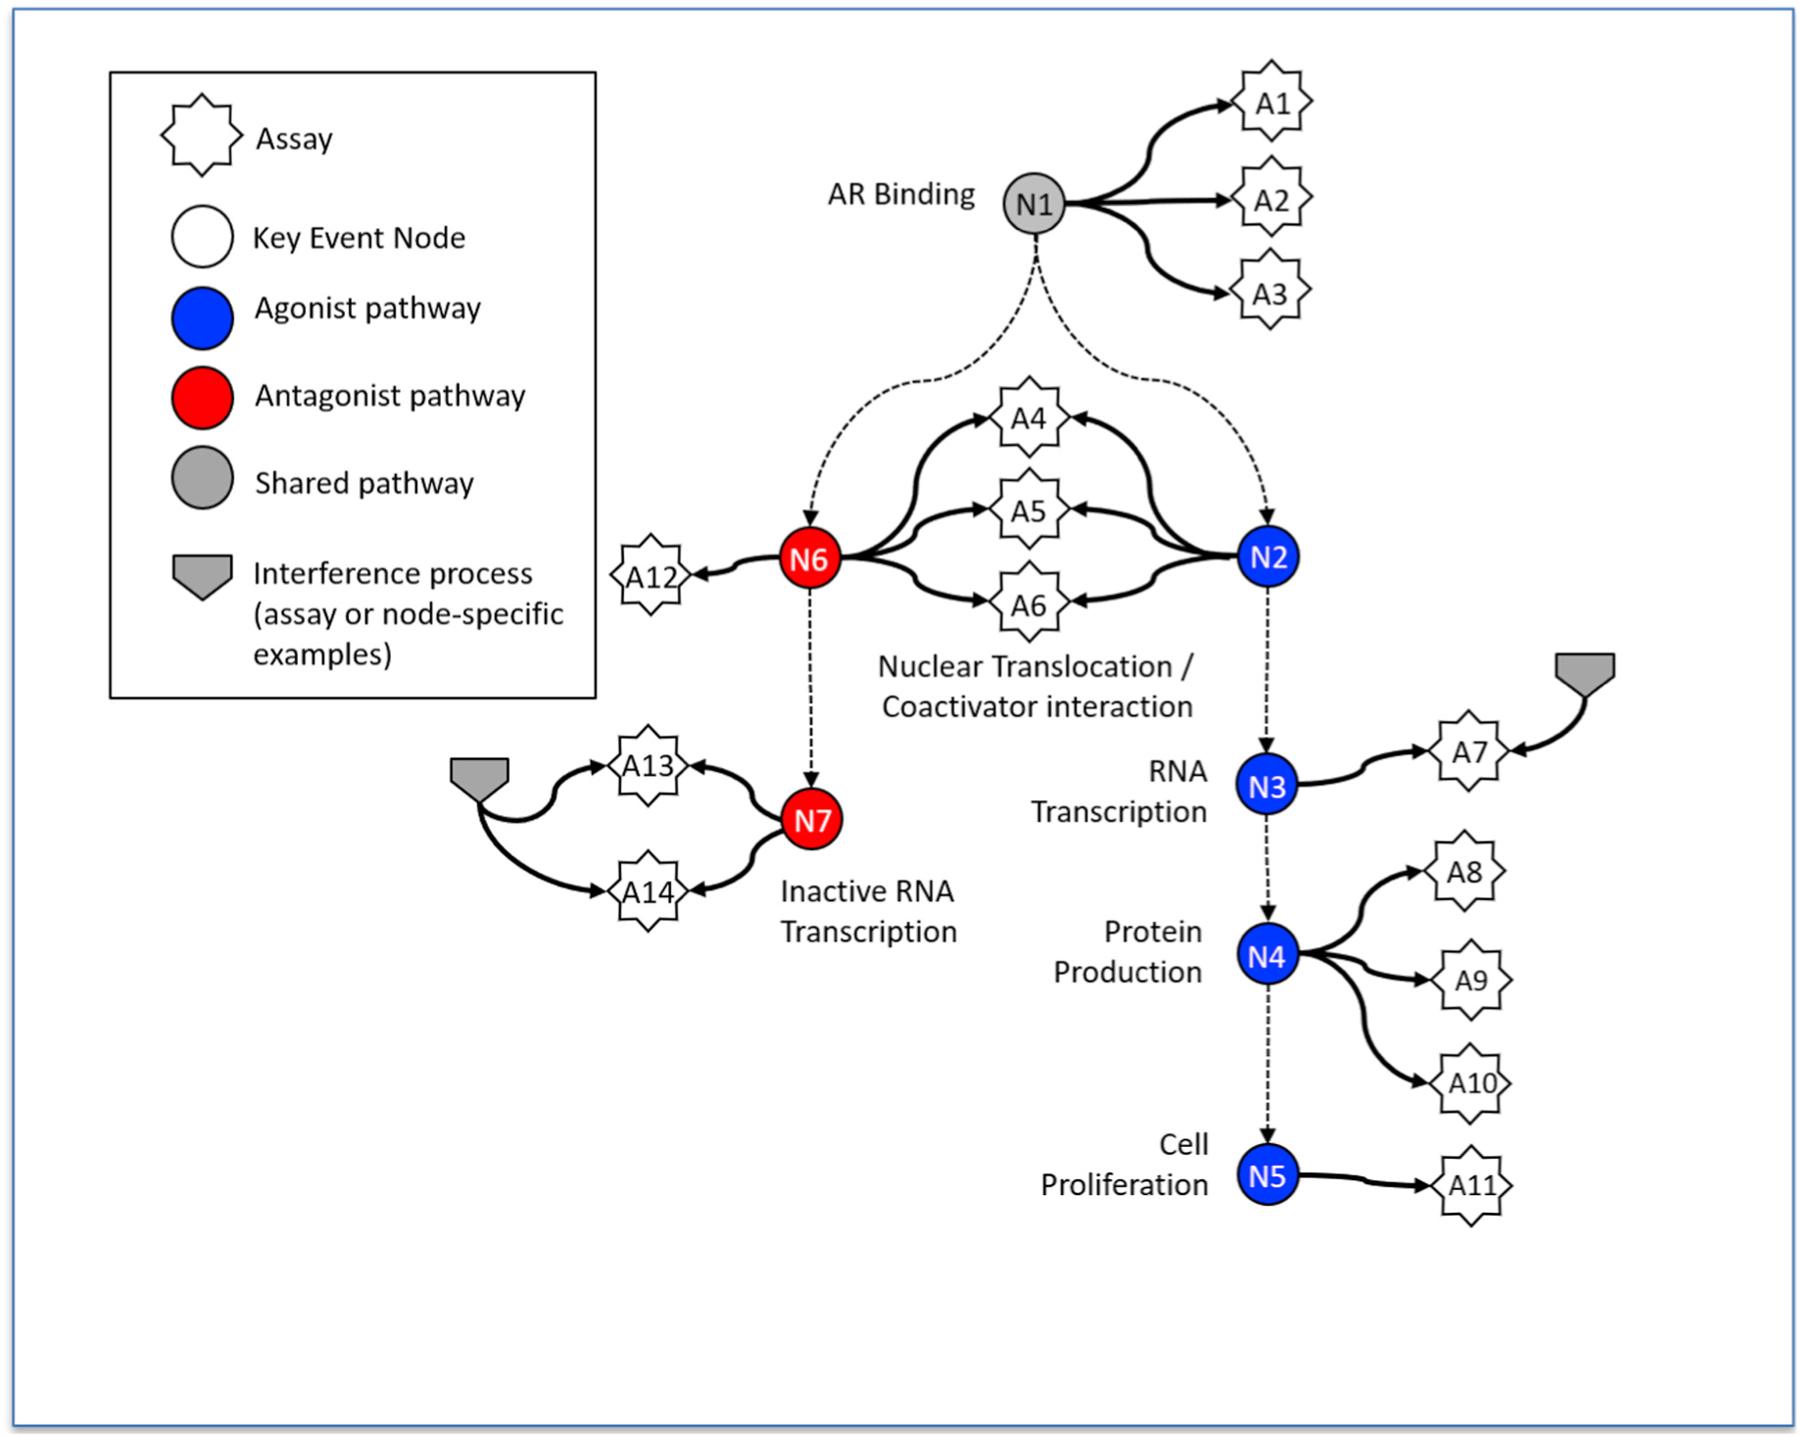
Fig. 1.

Diagram indicating the nodes in the AR signaling pathway associated with the assays. White stars indicate assays and correspond to the rows of Table 1. N1–N7 nodes correspond to processes in the underlying biological pathway, where blue is agonism, red is antagonism, and grey is common to both agonism and antagonism. Two representative assay interference processes are indicated, one affecting a single assay (A7) and another affecting a pair of related assays (A13 and A14). All single assays and groups of assays have their corresponding assay interference processes represented in the underlying mathematical model. See Kleinstreuer et al., 2017 for further details (Kleinstreuer et al., 2017). The strengths of these interference processes are indicated by the corresponding AUC values in Supplemental File S2.
