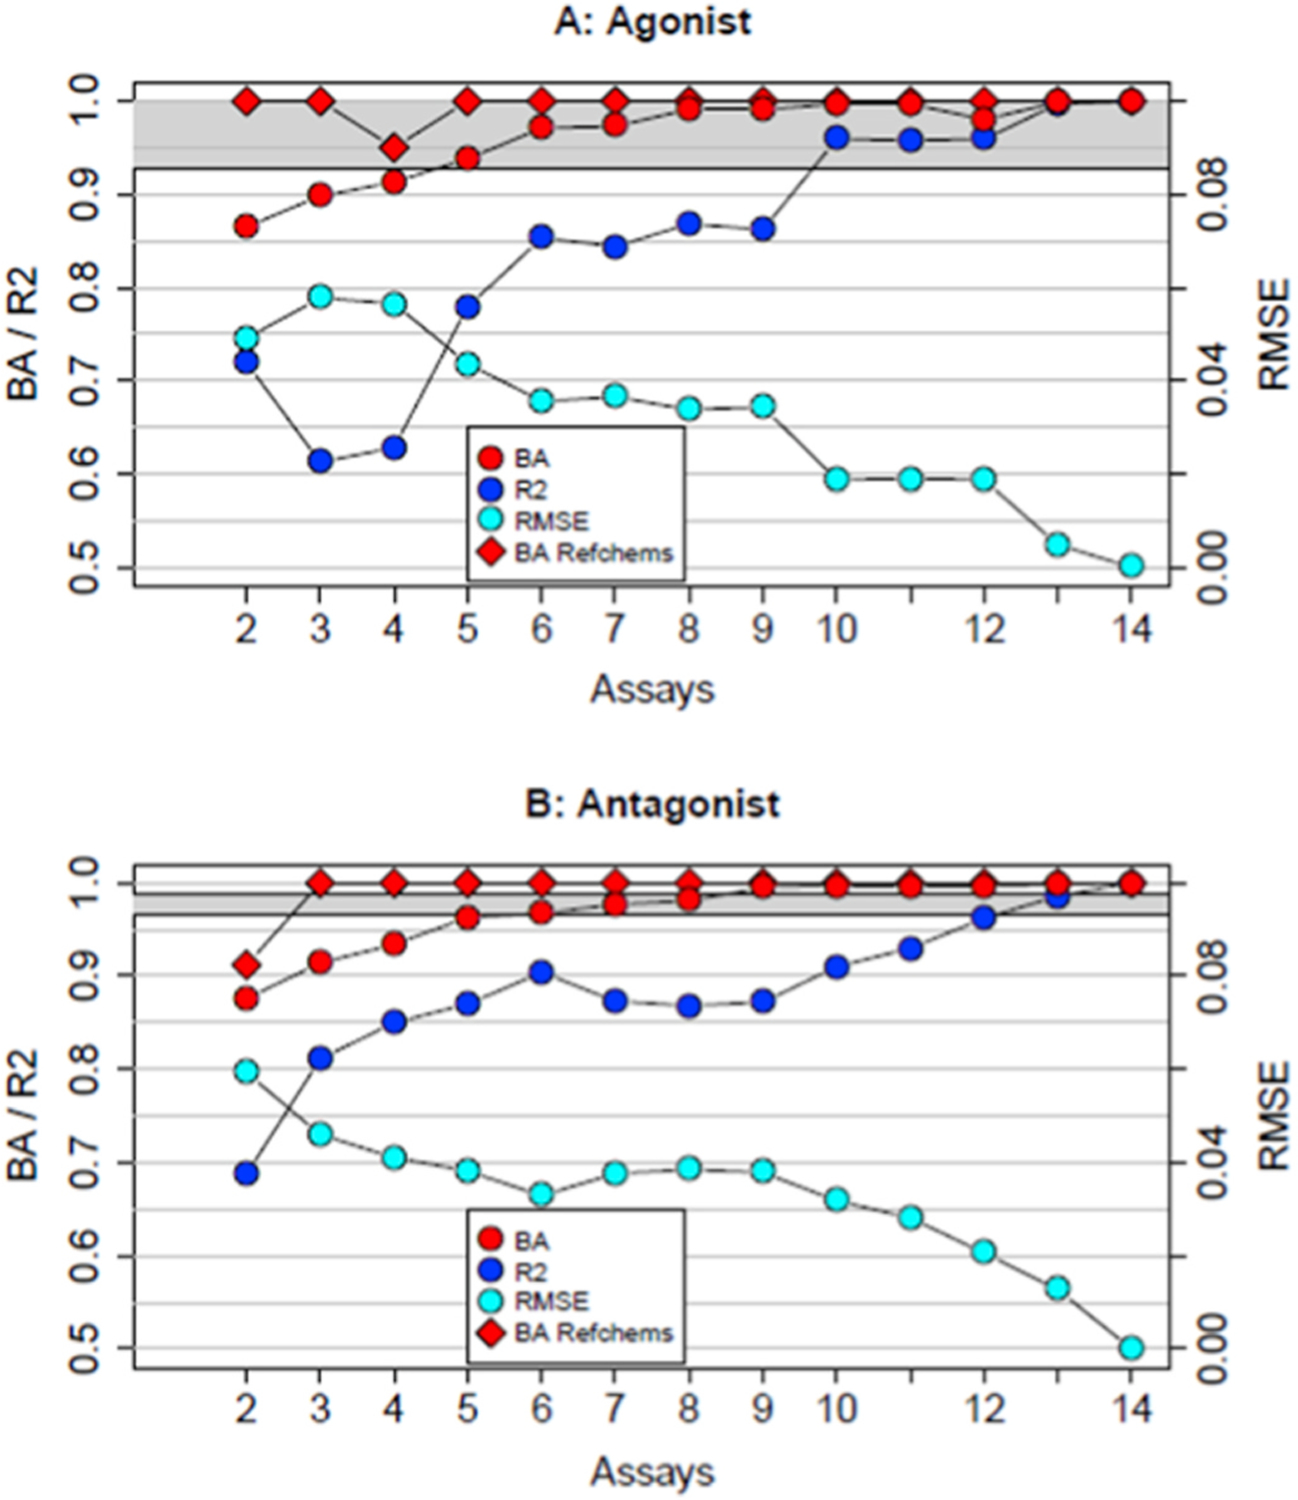
Fig. 2.

Summary of the best performing subset models for each number of assays. The model BA values are shown in red circles for all chemicals, and in red diamonds for the in vitro reference chemicals. The values of R2 (all chemicals) are shown in blue circles and for RMSE (all chemicals) in cyan circles. The y-scale for BA and R2 is on the left, and for RMSE is on the right. Panel A shows data for agonist mode and panel B shows data for antagonist mode. The grey bands show the 95% CI for the full model BA based on assay potency variability.
