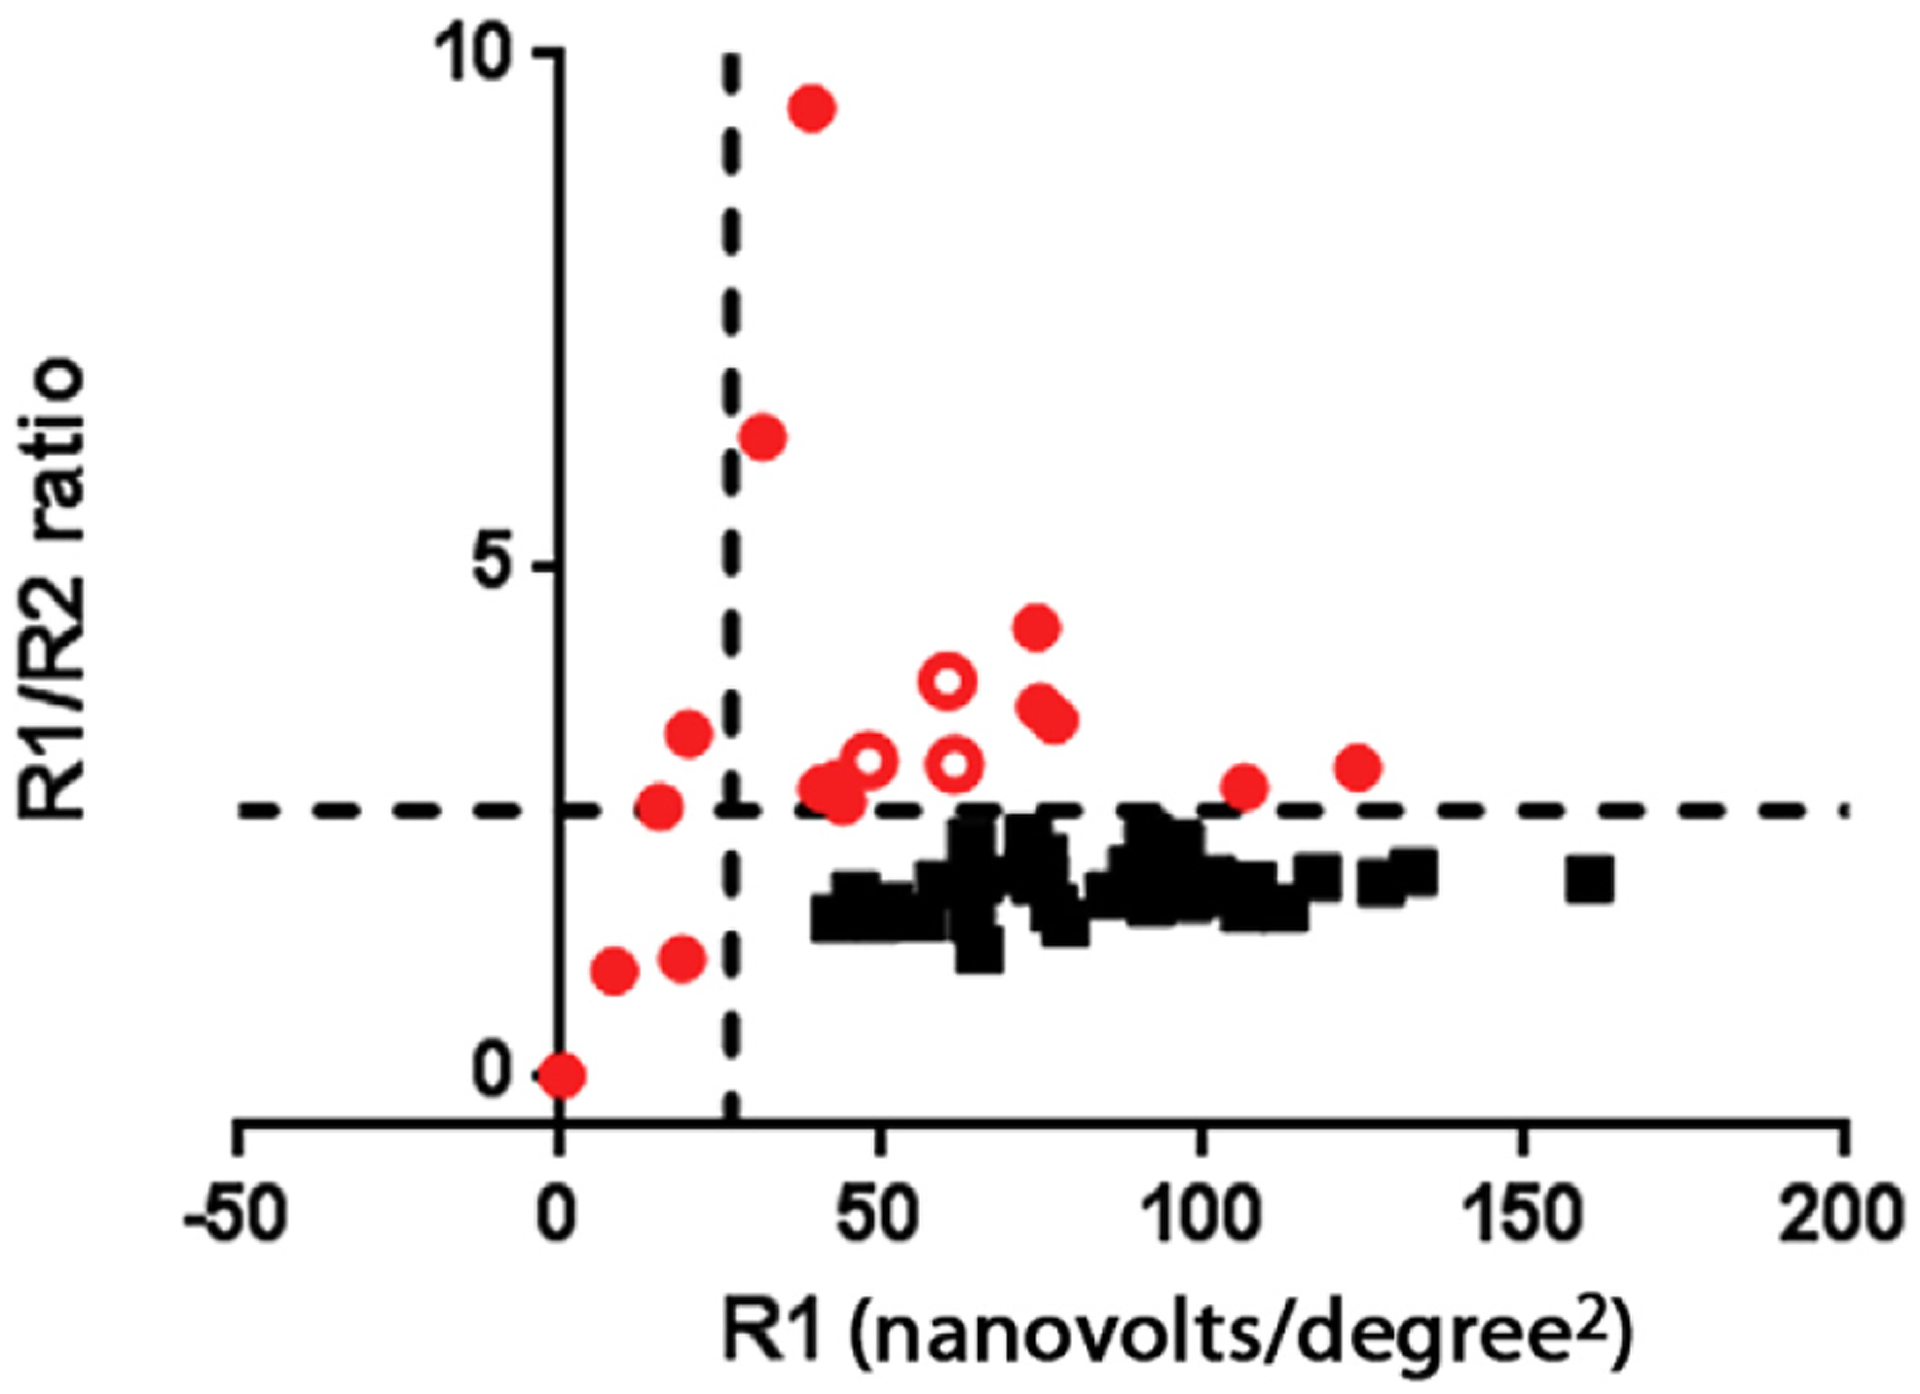
Figure 2.

Graph showing multifocal electroretinography (mfERG) data from the worse eye of all participants. R1 central amplitudes are reported from the output of the mfERG directly and R1/R2 plots ring ratios. All eyes categorized as unaffected are shown in solid red circles. Participants with both eyes meeting criteria for the affected category are shown in solid black squares. Open red circles indicate individuals with one eye meeting mfERG criteria for toxicity with the other eye not meeting criteria. One eye meeting criteria is sufficient in this analysis to categorize the person as affected.
