Figure 1.
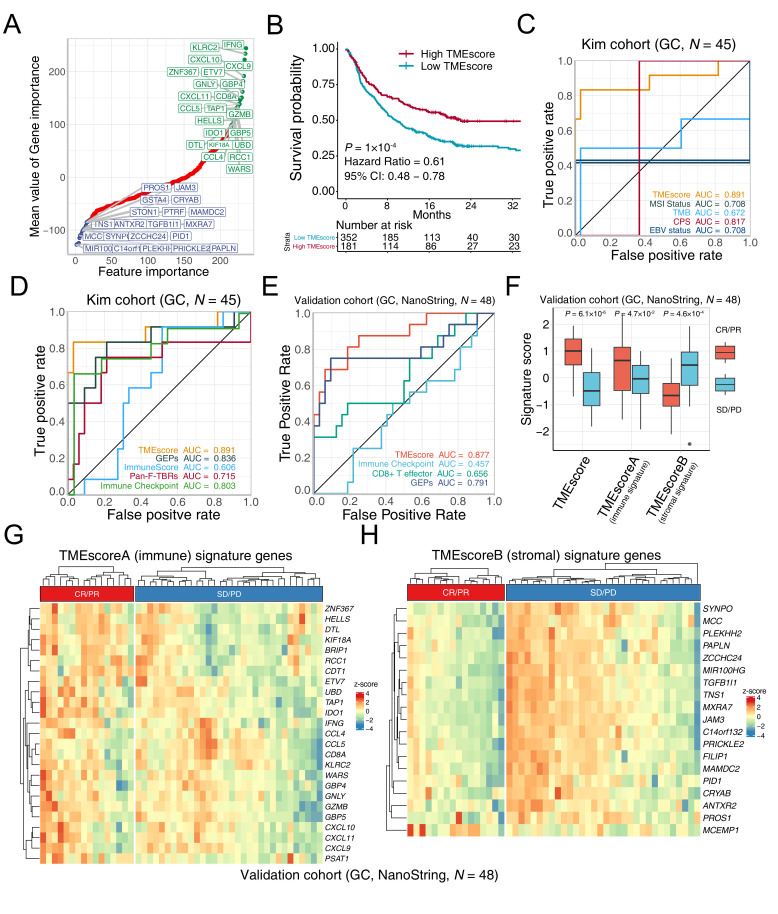
TMEscore holds promise in predicting immunotherapeutic response. (A) Feature engineering was conducted to minimize the number of TMEscore signature genes. Gene importance was exhibited with genes significantly associated with favorable immune checkpoint blockade (ICB) responses (top right, green), and genes correlated positively with immune exclusion and negatively with immunotherapeutic efficacy (bottom left, blue). (B) Kaplan-Meier survival analysis demonstrated that a high TMEscore was significantly related to more favorable overall survival in the study of multiple meta-data (p=1×10⁻⁴, HR=0.61, 95% CI: 0.48 to 0.78, cut-off=0.08). (C) Receiver operating characteristic (ROC) analyses indicated that the TMEscore harbored the highest area under the curve (AUC) (AUC=0.891) in comparison with other reported biomarkers of ICB, comprizing microsatellite instability (MSI) status, tumor mutation burden (TMB), programmed death-ligand 1 combined positive score (CPS), and Epstein-Barr virus (EBV) status in gastric cancer (AUC=0.708, 0.672, 0.817, 0.708, respectively; p values of pair comparison test see online supplemental table S7). (D) Tumor microenvironment (TME) relevant signatures and the TMEscore are estimated to compare the predictive sensitivity for responses. ROC analyses suggested that the TMEscore substantially outperformed these published transcriptomic-based methodologies for prediction of ICB treatment response, including gene expression profile scores (GEPs), ImmunoScore, pan-fibroblast transforming growth factor-beta (TGF-β) response signature (pan-fibroblast TGF-β response signature), and immune checkpoint (AUC=0.836, 0.606, 0.715, 0.803, respectively; detailed p values of pair comparison test see online supplemental table S7) (E–H) The predictive capacity of TMEscore for treatment response is corroborated in a multicenter clinical gastric cancer cohort. TMEscore possessed highest AUC surpassing immune checkpoint, CD8+ effector T cell and GEPs (AUC=0.877, 0.457, 0.656, 0.791, respectively); (E). Box plot supported that elevated TMEscore and TMEscoreA, as well as decreased TMEscoreB of responders (CR/PR) versus non-responder (SD/PD) in multicenter cohort (p=6.1×10⁻⁶, 4.7×10⁻², 4.6×10⁻⁴, respectively); (F). Heatmaps exhibited the signature genes expression of TMEscoreA (G) and TMEscoreB (H), respectively, in the responsive (CR/PR) and the progressive (SD/PD) gastric cancer, validating prior results. CR, complete response; PD, progressive disease; PR, partial response; SD, stable disease.

