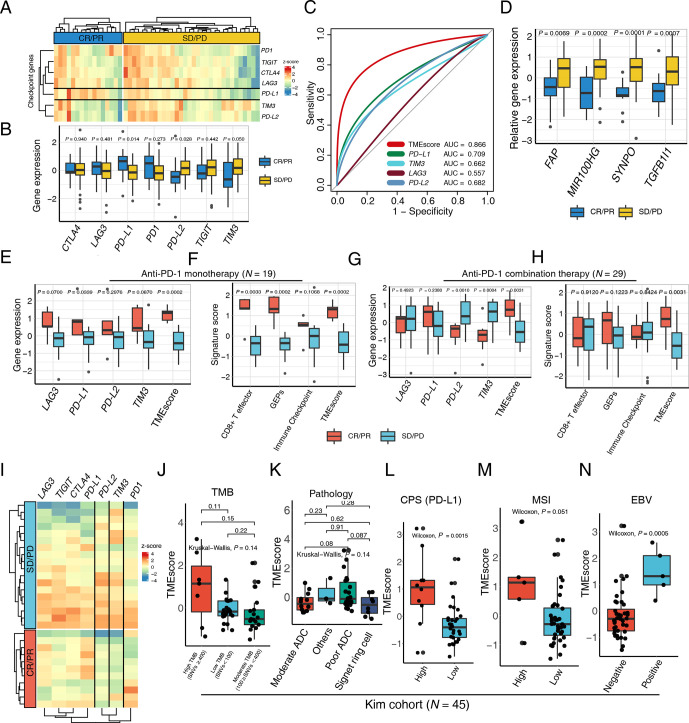
Figure 2.
TMEscore predicts efficacy of checkpoint immunotherapy alone or combination with chemotherapy. (A) A heatmap numerated the expression of various immune checkpoint genes in the responder (blue) and the non-responder (yellow) subsets, highlighting upregulation of programmed death-ligand 1 (PD-L1) in responsive patients in a multicenter cohort of gastric cancer. (B) The box plot compared the expression levels of immune checkpoint genes in the responsive (blue) and non-responsive (yellow) cancer settings and corresponding p values were displayed on the top. (C) Receiver operating characteristic curve analysis demonstrated that the TMEscore with highest predictive efficacy for therapy sensitivity (area under the curve (AUC)=0.866), outperforming all the immune checkpoints comprizing PD-L1, TIM3, LAG3, and PD-L2 (AUC=0.709, 0.662, 0.557, 0.682, respectively). (D) An elevation of stromal activation indexes, including FAP, MIR100HG, SYNPO and TGFB1l1 (p=0.0069, 0.0002, 0.0001, 0.0007, respectively), was discovered in the patients with complete response (CR) or partial response (PR) relative to the counterparts. (E–H) An upregulation of the aforementioned immune checkpoints (E) and immunotherapy pertinent biomarkers (F) including TMEscore, was measured in the context of anti-programmed cell death protein 1 (PD-1) monotherapy, as well as anti-PD-1 combination therapy (G–H). Relevant p values were depicted on the top. (I) Heatmap demonstrated aforementioned immune checkpoint expression discrepancies in the setting of anti-PD-1 combination therapy responder (red) and non-responder (blue), indicative of the upregulation of PD-L2 and TIM3 in the non-responsive subset. (J) No statistical significance was observed between tumor mutation burden (TMB) and TMEscore (Kruskal-Wallis test, p=0.14). The number of non-synonymous single nucleotide variant ≥400 was defined as high mutational load (high TMB); 100–400, moderate mutation load (moderate TMB); and <100, low mutation load (low TMB). (K) A boxplot exhibited bare statistical significance in TMEscore diversity among different pathologies of gastric cancers (Kruskal-Wallis test, p=0.14). (L) An increase of TMEscore was observed in PD-L1 combined positive score (CPS) positive patients (Wilcoxon, p=0.0015). The specimen was considered to have high PD-L1 expression if CPS≥1. (M–N) A boxplot demonstrated that gastric cancers with high microsatellite instability (MSI) status (M) (Wilcoxon, p=0.051) and positive Epstein-Barr virus (EBV) infective status (N) (Wilcoxon, p=0.0005) harbored an elevated TMEscore. ADC, adenocarcinoma; PD, progressive disease; SD, stable disease.

