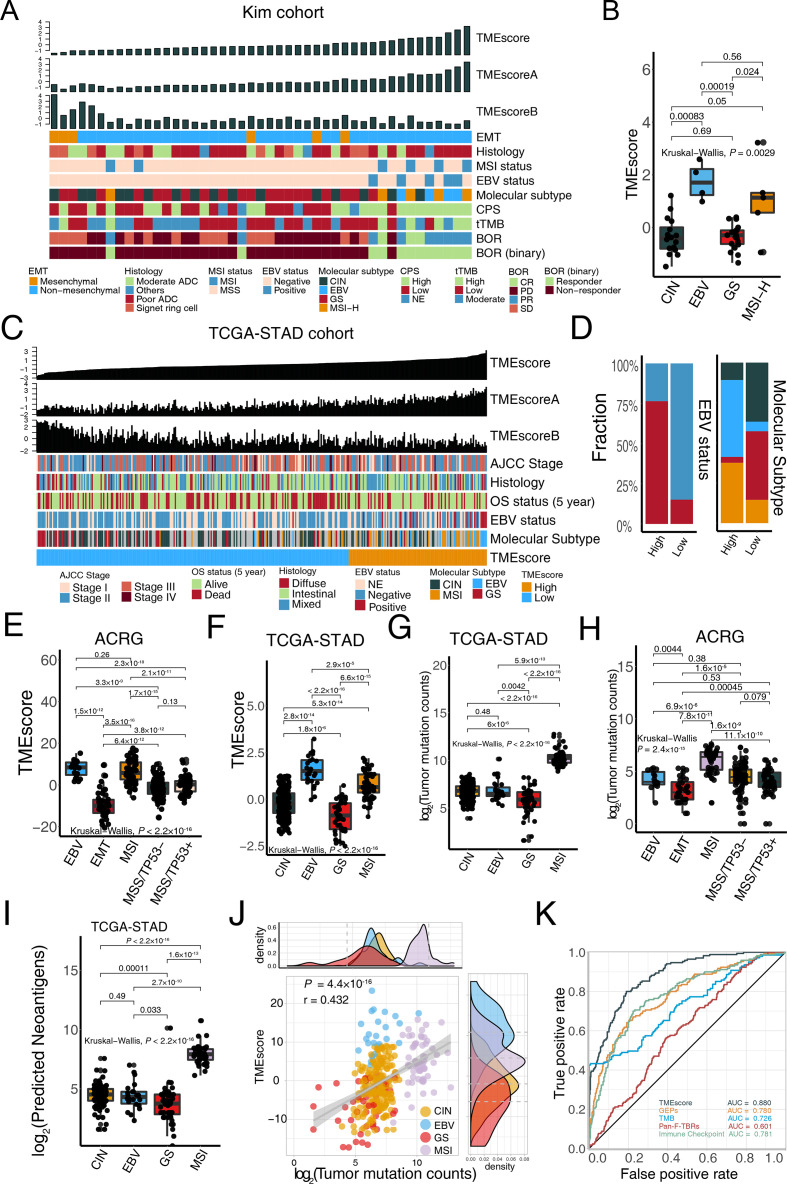
Figure 3.
TMEscore is closely correlated with microsatellite instability-high (MSI-H) and Epstein-Barr virus (EBV) infective status in gastric cancer. (A) For each patient (columns) with metastatic gastric cancer, clinicopathological features and molecular characterizations were annotated. Column annotations represent epithelial–mesenchymal transition (EMT) (mesenchymal, non-mesenchymal); histology (moderate adenocarcinoma (ADC), poor ADC, signet ring cell, others); MSI status (MSS, MSI); EBV status (negative, positive); molecular subtype (chromosomal instability (CIN), EBV, genomically stable (GS), MSI-H); programmed death-ligand 1 combined positive score (CPS) (high, low, NE); tissue tumor mutation burden (tTMB); best overall response (BOR) (CR, PR, PD, SD); and binary BOR (responder, non-responder) for each sample. TMEscore, TMEscoreA, and TMEscoreB are displayed at the top of the panel. A high TMEscore is capable of identifying patients with EBV positive and MSI-H and responders to immune checkpoint blockade. (B) EBV and MSI gastric molecular subtype were substantially associated with higher TMEscore in the Kim cohort (Kruskal-Wallis test, p=0.0029). (C–D) For each patient (columns) in The Cancer Genome Atlas of Stomach Adenocarcinoma (TCGA-STAD) cohort, the landscape of clinicopathological features and molecular characterizations are displayed. Column annotations represent the AJCC stage (stage I, II, III, IV); OS 5-year (alive, dead); histology (diffuse, intestinal, mixed); EBV status (negative, positive, NE); molecular subtype (CIN, EBV, GS, MSI-H); and TME subtype (high, low) for each sample. TMEscore, TMEscoreA, and TMEscoreB are displayed at the top of the panel (C). Analysis of TCGA-STAD cohort corroborated that patients with EBV positive and MSI-H harbored a higher TMEscore (D) (Fisher’s exact test, p<2.2×10⁻¹⁶). (E–H) Boxplots indicated the TMEscore is substantially elevated in EBV and MSI molecular subtype either in both Asian Cancer Research Group (ACRG) (E) (Kruskal-Wallis test, p<2.2×10⁻¹⁶) and TCGA-STAD cohorts (F) (Kruskal-Wallis test, p<2.2×10⁻¹⁶). However, TMB is positively related to the MSI subtype but is not predictive of EBV status in both TCGA-STAD cohort (G) (Kruskal-Wallis test, p<2.2×10⁻¹⁶) and ACRG cohort (H) (Kruskal-Wallis test, p=2.4×10⁻¹⁵). (I) Neoantigens failed to identify EBV status in TCGA-STAD cohort, despite its significant correlation with MSI-H subtype (Kruskal-Wallis test, p<2.2×10⁻¹⁶). (J) A dotplot demonstrated a close correlation between TMB and the TMEscore. Every single dot represents one sample, corresponding molecular subtypes are identified in different colors (CIN: yellow, EBV: blue, GS: red, MSI: pink) (Spearman test, r=0.432, p=4.4×10⁻¹⁶). (K) ROC analyses suggested the TMEscore was predictive of EBV and MSI status of gastric cancer in TCGA-STAD and ACRG cohorts (n=634), with a higher AUC than that of gene expression profile scores and TMB (AUC=0.88, 0.78, 0.726, respectively). AJCC, The American Joint Committee on Cancer; OS, overall survival; CR, complete response; NE, unknown; PD, progressed disease; PR, partial response; SD, stable disease.

