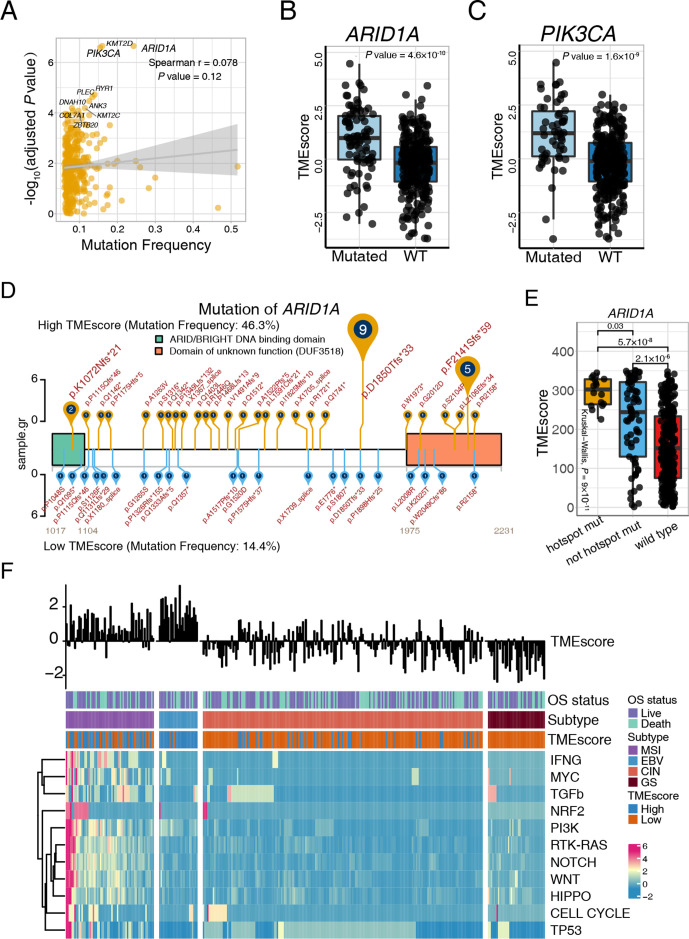
Figure 4.
ARID1A and PIK3CA mutation potentiate antitumor immunity. (A) Mutation frequency and corresponding levels of TMEscores are exhibited in the dotplot, and the significance of ARID1A, PIK3CA, and KMT2D mutations are highlighted. Every single spot represents a gene, and statistical significance was shown through y-axis (Spearman test, r=0.078, p=0.12). (B–C) ARID1A (B) and PIK3CA (C) mutations were significantly associated with an increase of TMEscore. ARID1A (Wilcoxon, p=4.8×10⁻¹⁰) and PIK3CA (Wilcoxon, p=1.6×10⁻⁹) mutations were categorized in a binary way. (D–E) The landscape of the ARID1A mutation positions and corresponding TMEscore was displayed and highlighted p.D18550Tfs*33 and p.F2141Sfs*59 of ARID1A mutation in the high-TMEscore tumors. The mutation rates of high (yellow) and low (blue) TMEscores are shown (D). The ARID1A recurrent mutation is correlated with the higher TMEscore (Kruskal-Wallis test, p=9×10⁻¹¹) (E). (F) The landscape of intrinsic pathway mutations (rows) is characterized for each sample (columns). Column annotations represent OS status (live, dead), molecular subtype (chromosomal instability (CIN), Epstein-Barr virus (EBV), genomic stable (GS) and microsatellite instability (MSI)); and tumor microenvironment (TME) subtype (high, low). The TMEscore is displayed in the top panel. Genomic mutations were limitedly enriched in the EBV molecular subtype, which exhibited a high TMEscore. Colors (blue to red) represent the corresponding expression levels (low to high). WT, wild type; OS, overall survival.

