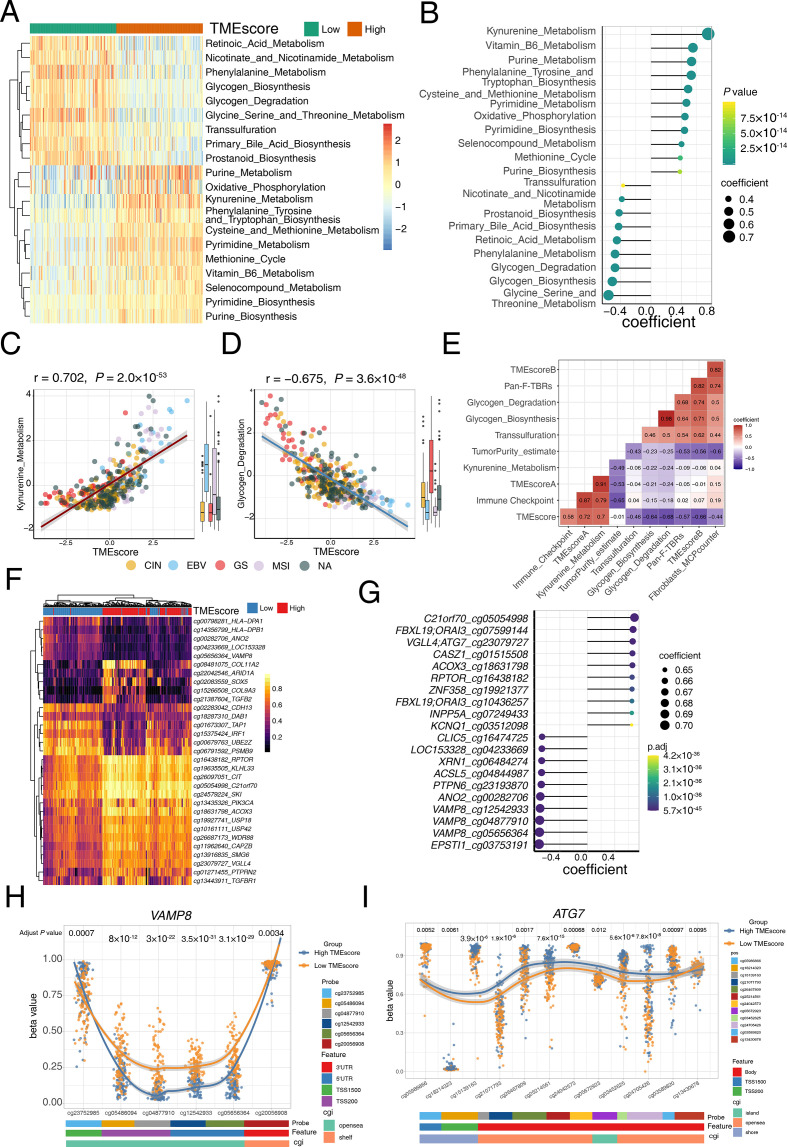
Figure 5.
Tumor microenvironment (TME) associated metabolism and methylation characteristics. (A) Wilcoxon test show the differentially express metabolism pathway in high and low TMEscore tumor. For each patient (columns), signaling pathways (rows) are characterized in the heatmap. Colors (blue to red) represent the corresponding expression levels (low to high). Column annotations high (orange) and low (green) TMEscore. (B) Correlation analysis highlighted the most significant metabolism pathways in the high and low TMEscore tumors. Annotations of the pathways are listed on the left. Colors (yellow to green) represent p values, and the size of each dot represents the spearman coefficient. (C) A scatter plot demonstrated a close correlation between the TMEscore and kynurenine metabolism. Every single dot represents one sample, and corresponding molecular subtypes are identified in different colors (chromosomal instability (CIN): yellow, Epstein-Barr virus (EBV): blue, genomically stable (GS): red, microsatellite instability (MSI): pink; Spearman test, r=0.702, p=2.0×10−53). Kynurenine metabolism was significantly activated in EBV and MSI subtype (Kruskal-Wallis test, p=3.3×10⁻¹⁰). (D) A scatter plot demonstrated a close correlation between the TMEscore and glycogen metabolism. Every single dot represents one sample, and corresponding molecular subtypes are identified in different colors (CIN: yellow, EBV: blue, GS: red, MSI: pink; Spearman test, r=−0.675, p=3.6×10−48). Glycogen metabolism was significantly activated in GS subtype (Kruskal-Wallis test, p<2.2×10⁻¹⁶). (E) A corrplot displays correlations among kynurenine metabolism, glycogen metabolism and TME-related signatures. Coefficients are characterized in number. Colors red and purple represent positive and negative correlations. (F) The heatmap exhibited the landscape of differentially methylated genes in high and low TMEscore tumors. For each patient (columns), significant methylated regions of specific genes (rows, annotated on the right) are characterized. The column annotations represent high (red) and low (blue) TMEscore. Colors (yellow to purple) represent the corresponding methylation levels (low to high). (G) Correlation analysis highlighted the top 20 methylated probes and genes in the high and low TMEscore tumors. Annotations of the probes and genes are listed on the left. Colors (green to purple) represent p values, and the size of each dot represents the spearman coefficient. (H) The discrepancy of VAMP8 methylation in different regions in high (blue) and low (yellow) TMEscore. Annotations of probes (cg23752985, cg05486094, cg04877910, cg12542933, cg05656364, cg20056908), features (3′UTR, 5′UTR, TSS1500, TSS200), and CpG islands (CGI) (opensea, shelf) are exhibited on the bottom panel. (I) The discrepancy of ATG7 methylation in different regions in high (blue) and low (yellow) TMEscore. Pan-F-TBRs, pan-fibroblast TGF-β response signature.

