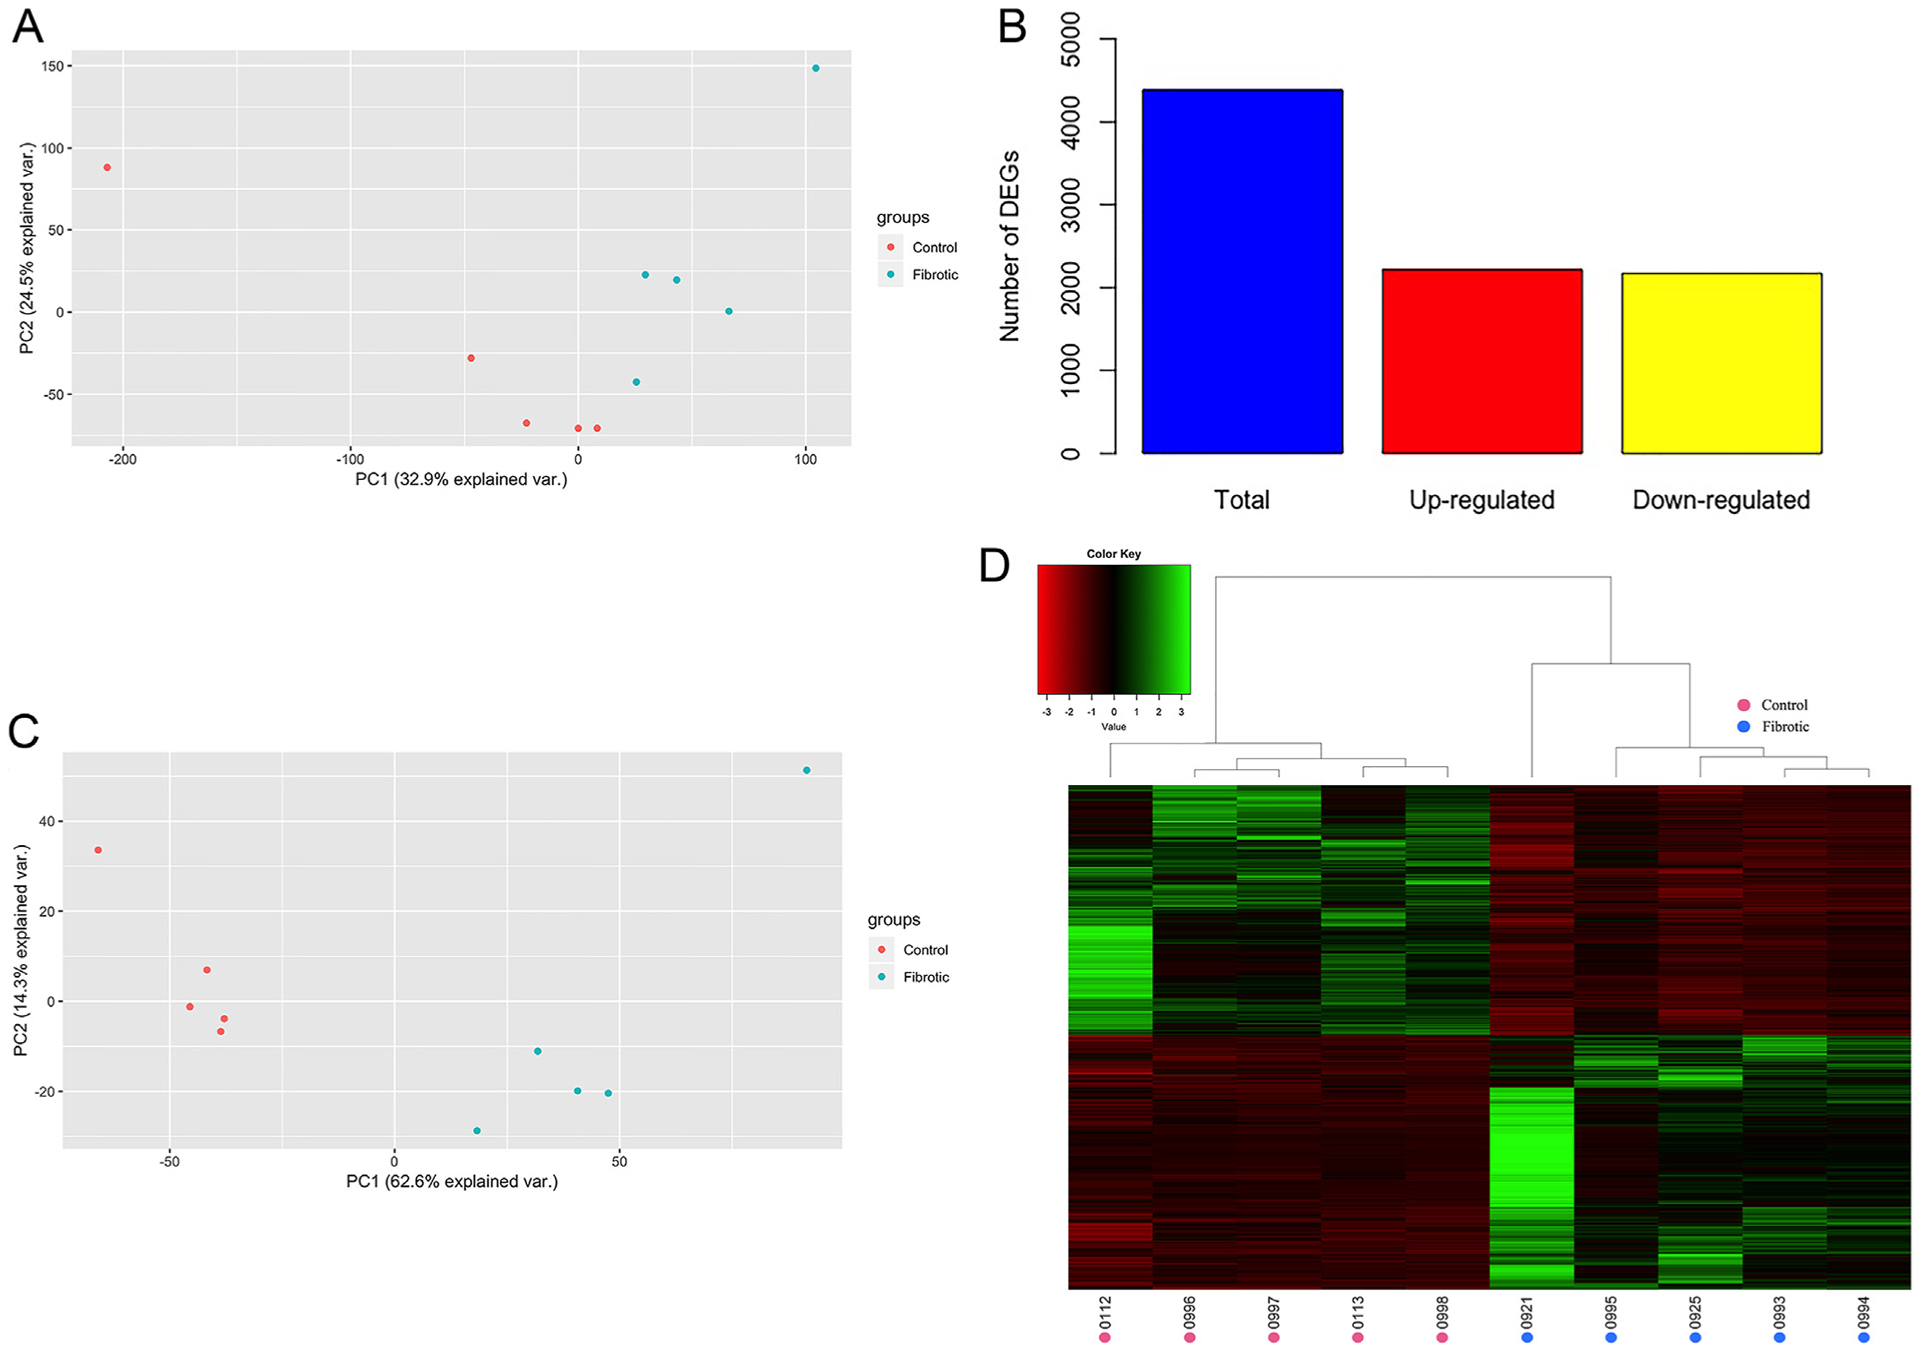
Fig. 2. Alcohol exposure results in reproducible alteration of hepatic gene expression profiles.

(A) PCA plot demonstrating clustering of samples by group based on the relative expression of 21,748 genes for which expression information was available for each sample. (B) Total number of DEGs, including those up- and down-regulated in the fibrotic compared to control group. (C) PCA plot demonstrating samples cluster by group based on the 4387 DEGs. (D) Heatmap of the normalized expression level of the 4387 DEGs for each sample, represented as z-scores. Dendrograms represent relationships between samples (columns) based on complete linkage clustering.
