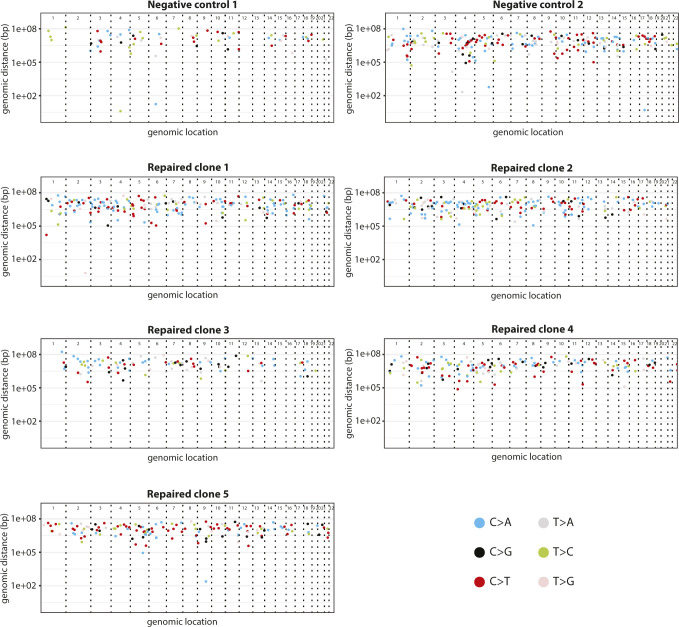
Figure S5. Rainfall plots of prime-edited clones and negative controls.
Rainfall plots of prime editing repaired CFTR-R785* clonal organoid lines and their respective negative controls. Every identified mutation is indicated with a dot (color according to mutation type) and is ordered on the x-axis from chromosome 1 to chromosome 22. The y-axis shows the distance between each mutation and the one before it (the genomic distance) and is plotted on a log scale.

