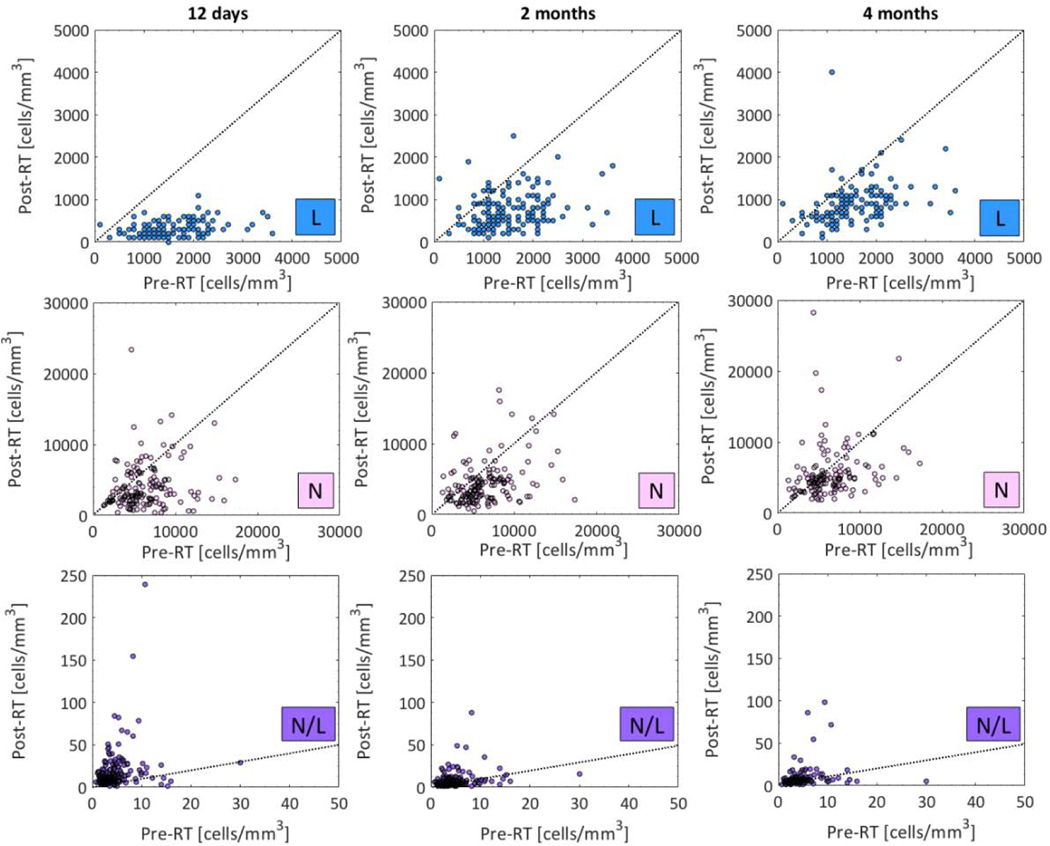
Fig.1.
Distributions of L, N, and N/L (upper, middle, and lower) pre- RT (x-axis) and at the three post-RT time points (y-axis; 12 days, 2 months, and 4 months post-RT: left, middle, and right panel). Note: See Table 2 for population medians (range) and p-values for post-RT and pre-RT comparisons. Dotted line: Identity line.

