
. 2020 May 5;16(2):e1086. doi: 10.1002/cl2.1086
© 2020 The Authors. Campbell Systematic Reviews published by John Wiley & Sons Ltd on behalf of The Campbell Collaboration
This is an open access article under the terms of the http://creativecommons.org/licenses/by/4.0/ License, which permits use, distribution and reproduction in any medium, provided the original work is properly cited.
Figure 3.
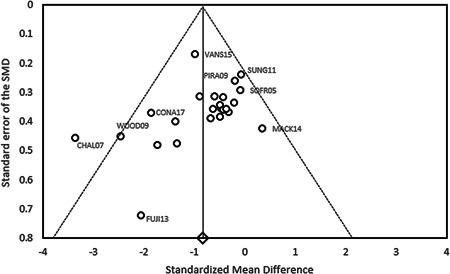
Funnel plot of the 24 included studies