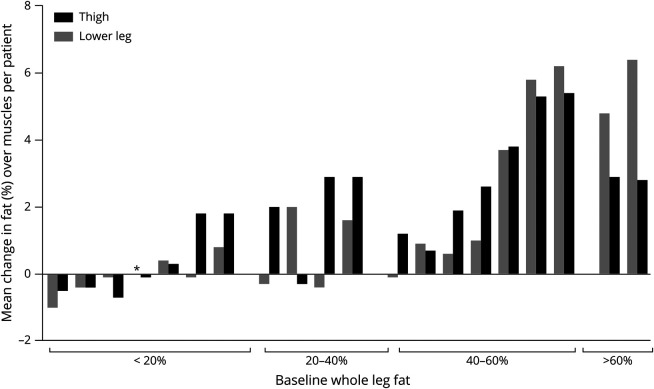
Figure 3. Mean Change in Fat in Thigh and Lower Leg Whole Muscles per Patient.
Each patient is represented by a black and gray bar stitched together. Black and gray bars indicate mean change over thigh and lower leg muscles, respectively. Patients are subdivided in 4 groups based on their average weighted fat over all thigh and lower leg muscles (<20%, 20%–40%, 40%–60%, and >60% fat). *Mean change of zero.

