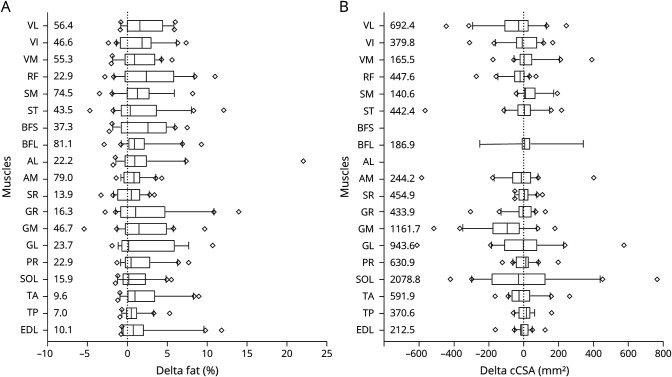
Figure 4. Change in Fat and Contractile Cross-Sectional Area (cCSA) Over 24 Months.
(A) Change in fat over 24 months. (B) Change in cCSA over 24 months. Boxes show median (IQR). The lines represent the 10th–90th percentile with diamonds indicating values outside this window. Median baseline values are given at the left border. AL = adductor longus; AM = adductor magnus; BFL = biceps femoris long head; BFS = biceps femoris short head; EDL = extensor digitorum longus; GL = gastrocnemius lateralis; GM = gastrocnemius medialis; GR = gracilis; PR = peroneus; RF = rectus femoris; SM = semimembranosus; SOL = soleus; SR = sartorius; ST = semitendinosus; TA = tibialis anterior; TP = tibialis posterior; VI = vastus intermedius; VL = vastus lateralis; VM = vastus medialis.

