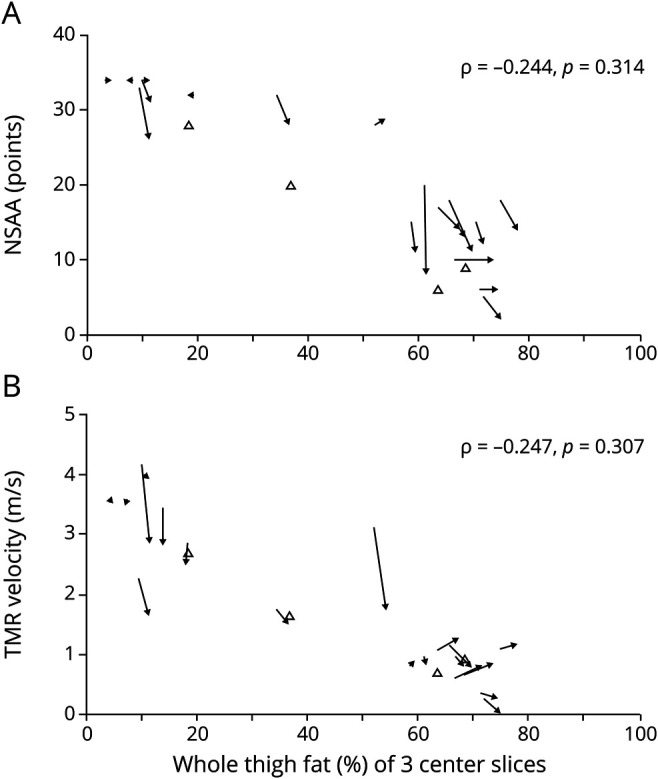
Figure 5. Relation Between Change in Function Tests and Fat Fraction (FF).

Change in whole thigh FF of 3 center slices vs (A) North Star Ambulatory Assessment (NSAA) and (B) 10-meter run test (TMR) velocity. Closed arrows: patients with baseline and follow-up measurements. Open triangles: patients with only 1 measurement (baseline). Horizontal arrows indicate functionally stable patients but with a change in FF.
