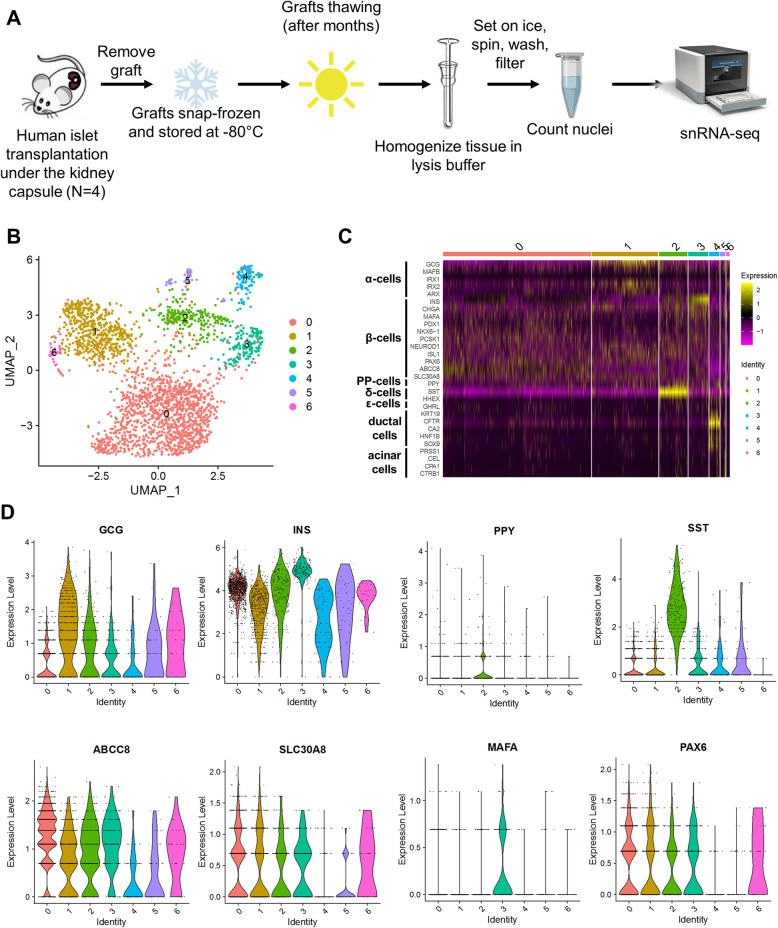
Fig. 4.
Single-nucleus RNA-sequencing in human islet grafts. A Experimental scheme of isolation of nuclei and snRNA-seq protocol in transplanted human islets. B Global UMAP plot displaying clustering of high-quality nuclei derived from engrafted human islets. C Heatmap representing standardized gene expression (standardized natural log of counts) of selected endocrine and exocrine gene markers in each nucleus separated by cluster. Each column represents a single nucleus, and each row is a different gene. (D, upper panels) Violin plots representing the expression levels of endocrine cell gene markers, including insulin (INS), glucagon (GCG), pancreatic polypeptide (PPY), or somatostatin (SST) in each nuclear cluster. (D, lower panels) Violin plots representing the expression levels of β-cell gene markers, such as ABCC8, SLC30A8, MAFA, and endocrine markers, such as PAX6 within the nuclear clusters. Expression levels (Y-axis) are natural log of counts

