Fig. 2.
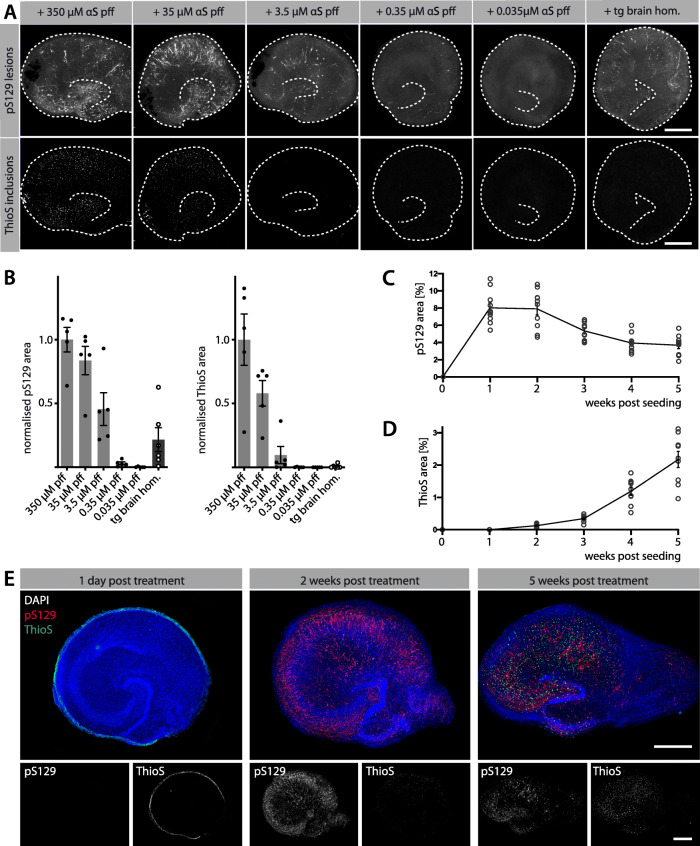
Induction of αS inclusions is seed-, concentration- and time-dependent. See Fig. 1A for treatment scheme. (A) Immunofluorescence staining for pS129 and ThioS in tg HSCs at 5 weeks post-seeding. The concentration of αS pff (350 μM with subsequent 10- to 10,000-fold dilutions) determines the abundance of pS129-positive αS inclusions (largely neuronal) and ThioS-positive inclusions (largely microglial) in tg HSCs. Brain homogenate shows approximately the seeding activity of 1:100 αS pff. However, the seed concentration in the brain homogenate is likely much lower compared to the one of αS pff (see Results). Scale bars = 50 μm. (B) Normalised quantification of pS129-positive and ThioS-positive inclusions in tg HSCs treated with different concentrations of αS pff (light grey bars) or with tg brain homogenate (dark grey bar). Mean ± SEM is shown; n = 5–6 HSCs per group. (C, D) Quantification of percentage of pS129-positive (C) and ThioS-positive (D) αS inclusions over time using 35 μM αS pff. Mean ± SEM are shown; n = 9 HSCs per group and timepoint. (E) Distribution of pS129- and ThioS-positive aggregates in tg HSCs treated analysed at 1 day, 2 weeks or 5 weeks post-treatment. After 1 day, ThioS-positive αS pff (green) still surrounded the culture with no induction of αS lesions. At 2 weeks, pS129-positive neuronal inclusions (red) were abundant, but appeared to decline at 5 weeks post-seeding. In contrast, ThioS-positive microglia inclusions increased from 2 to 5 weeks post-seeding. Scale bars represent 500 μm

