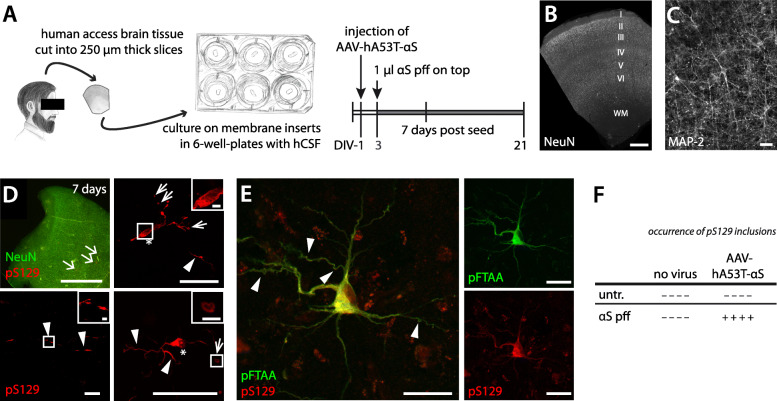
Fig. 5.
Induction of αS inclusion in adult human brain slice cultures. (A) Schematic of the preparation and treatment scheme of human neocortical slice cultures obtained from brain resection. Healthy access tissues of resected brain were used to prepare human slice cultures. Cortical tissue was sectioned into 250 μm slices perpendicular to the cortical surface. At day in vitro 1 (DIV-1), some cultures were injected with AAV-hA53T-αS to induce overexpression of αS. At DIV-3, 1 μl of αS pff (35 μM) was added on top of each culture. At DIV-10, the human slice cultures were fixed for histological analysis. Drawing shows fictional patient. (B, C) Immunofluorescence staining of neuronal nuclei (NeuN) show preserved neuronal layers I-VI at DIV-10, the time of fixation (WM = white matter) (B). Neuronal cell bodies with processes appear also intact (MAP-2-immunostaining; shown is DIV-12). Scale bars = 1 mm (B) and 50 μm (C). These observations are consistent with previous work demonstrating that resected human tissue can be cultured and maintain electrophysiological properties up to DIV-21 if the medium is replaced with human CSF [29]. (D) Immunofluorescence staining for pS129 (red) in a human slice culture at 7 days post-seeding. Arrows in top left panel point to sites where neurons developed pS129-positive inclusions. Neuronal nuclei were stained by NeuN (green). Top right, bottom left and bottom right panels show single neurons with pS129-positive inclusions (from 3 different cultures). Note the diffuse and large inclusion in the neuronal soma (asterisks) and the filamentous inclusions in the processes (arrowheads) with often large spheroid-like inclusions (narrow arrows). Scale bars represent 1 mm (top left), 50 μm (top right, and bottom row) and 5 μm (inserts). (E) Immunofluorescence staining for pS129 antibody (red) and the amyloid-binding dye pFTAA (green). Note that the red labelling in the background is lipofuscin autofluorescence. Scale bars represent 50 μm. (F) Table summarises the results from seeded αS aggregation in human cultures. The formation of pS129-positive inclusions is indicated by a (+) or (−) for each culture (n = 4 cultures/condition; cultures are derived from 3 patients with ages between 22 and 61 years old)

