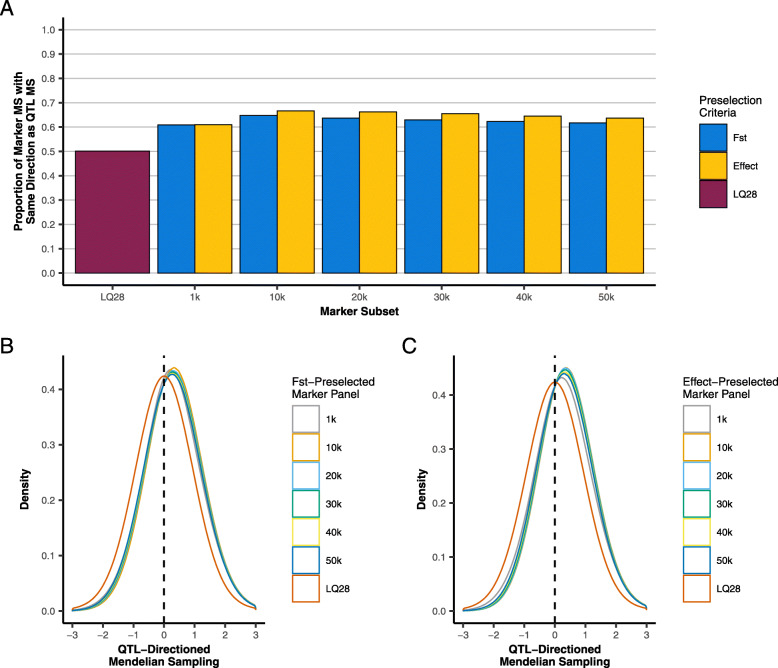
Fig. 3.
Characterization of the modelling of QTL Mendelian Sampling (MS) based on FST- and estimated-effects-preselected markers: a) The proportion of relationships among training individuals for which marker-estimated and QTL MS fall in the same direction relative to expected additive relationships. b and c The distribution of marker-estimated MS for relationships among training individuals with sign reflecting whether marker-estimated and QTL MS fall in the same (+) or opposite (−) direction relative to the expected additive relationship

