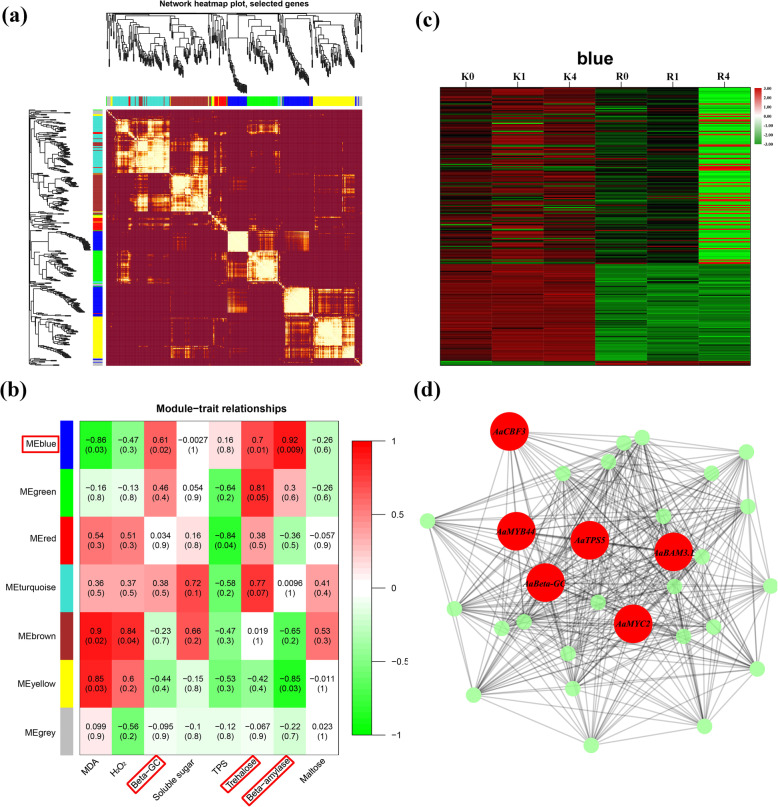
Fig. 10.
Identification of coexpression network modules in kiwifruit. (a) Cluster dendrogram and heat map of genes subjected to coexpression module calculations. (b) Module-trait associations based on Pearson correlations. The color key from green to red represents r2 values from − 1 to 1, respectively. (c) Heat map constructed for the blue module genes. (d) Gene network of the blue module, which is positively correlated with beta-GC (r2 = 0.61), trehalose (r2 = 0.7), and BAM (r2 = 0.92) contents. The candidate genes within the blue module are highlighted in red due to the higher weight within the module and coded for gene descriptors based on annotations

