
Figure 6.
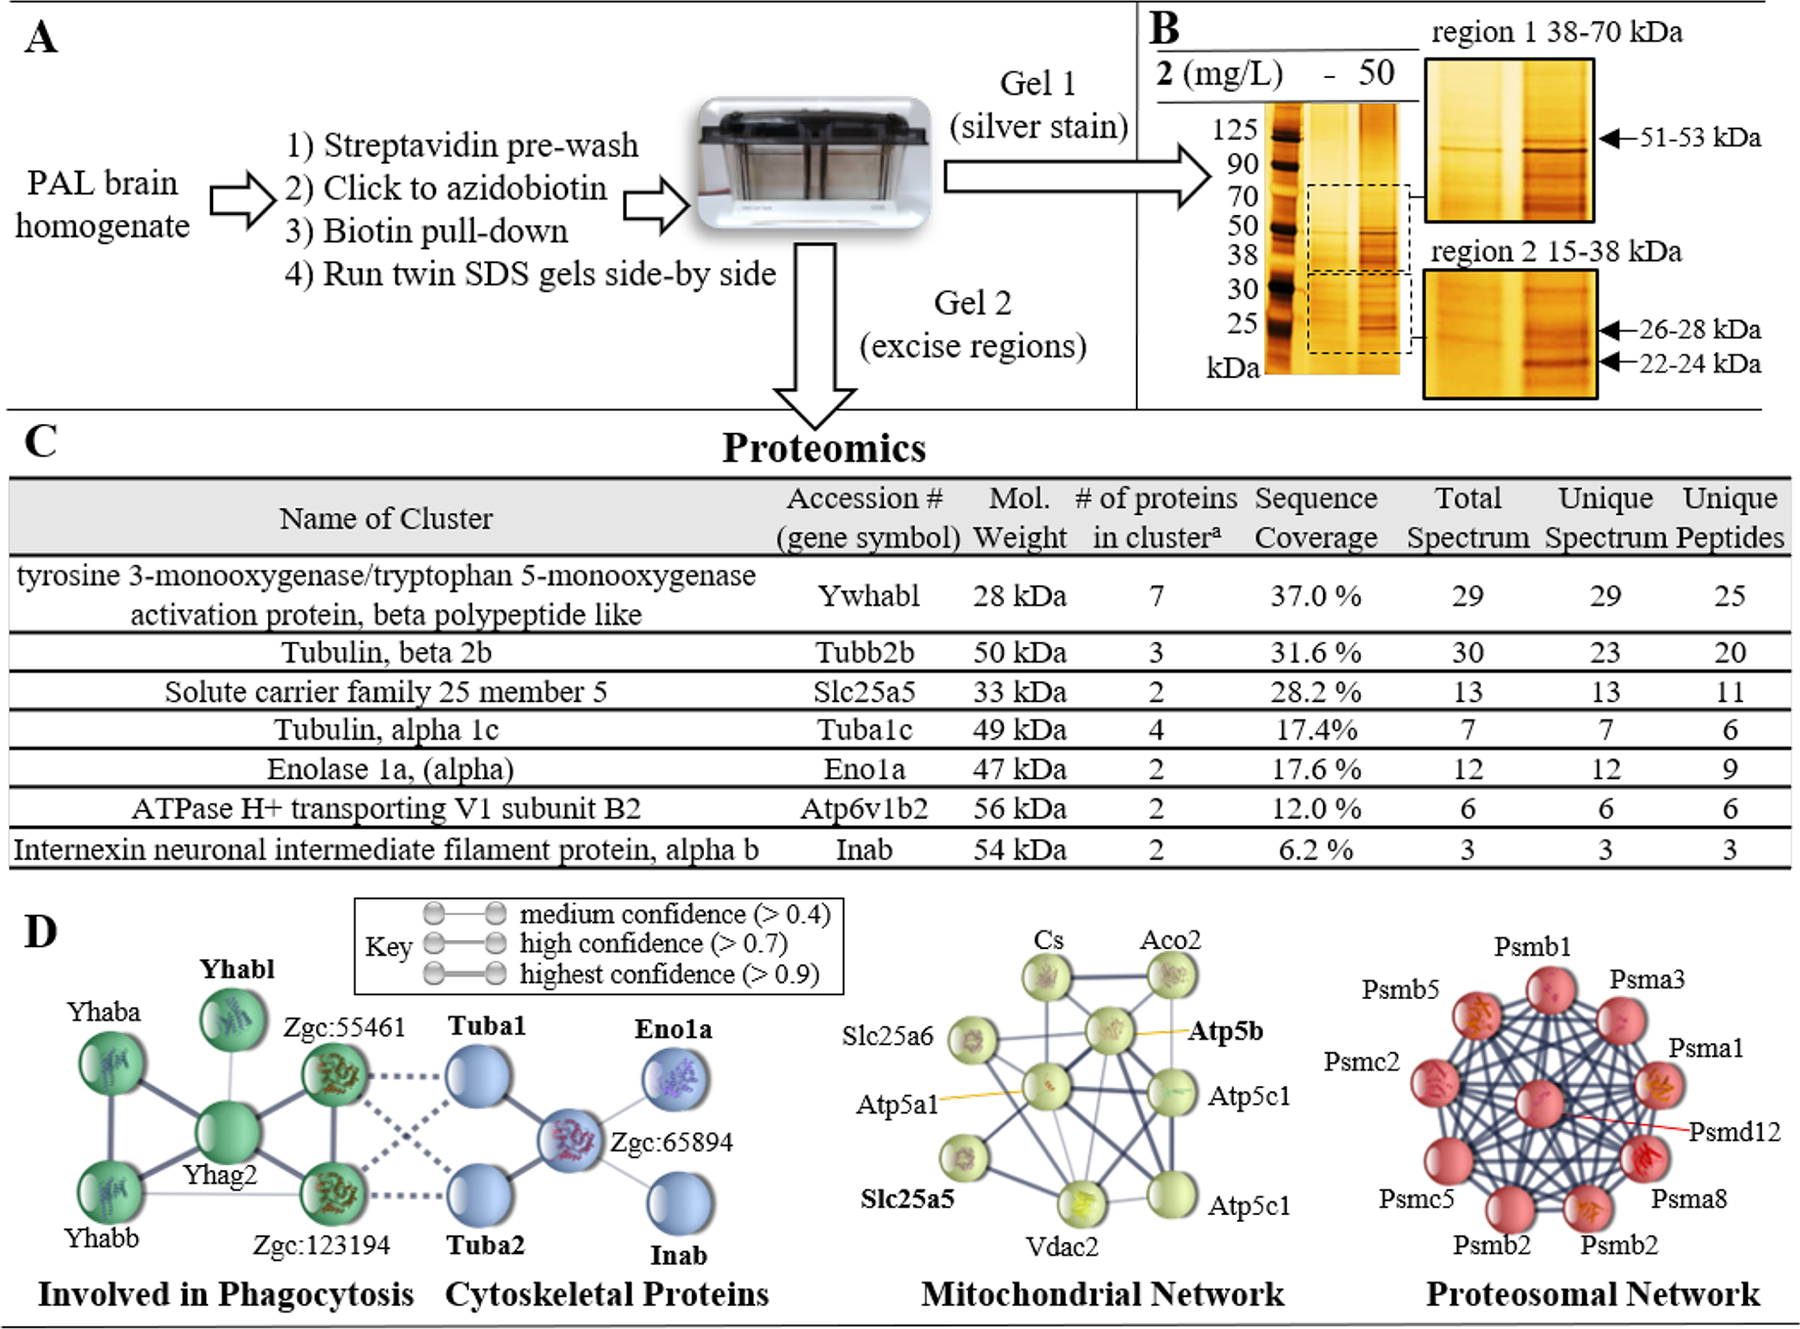
A) Experimental workflow for biotin pull-down. Two gels were run side-by-side. One gel was silver stained to visualize proteins and inform cutting of the unstained gel. B) Silver stain of the SDS PAGE using samples from the biotin pull-down for fish treated either with vehicle or 2 (50 mg/L). The gel regions (region 1 [38–70 kDa] and region 2 [15–38 kDa]) which were selected for excision from the unstained gel for submission to proteomics are magnified. C) Protein clusters identified during proteomic analysis which were not present in vehicle treated pulldown. D) Bioinformatic analysis of covalently modified binding partners identified with > 95 % certainty using STRING. Four interaction networks were identified, including: phagocytosis (green nodes); cytoskeletal proteins (blue nodes); mitochondrial proteins (yellow nodes); and proteasomal proteins (red nodes). Gene symbols shown in bold were those identified in proteomic cluster analysis. Unconnected nodes and low confidence interactions were omitted for clarity.