
Figure 11.
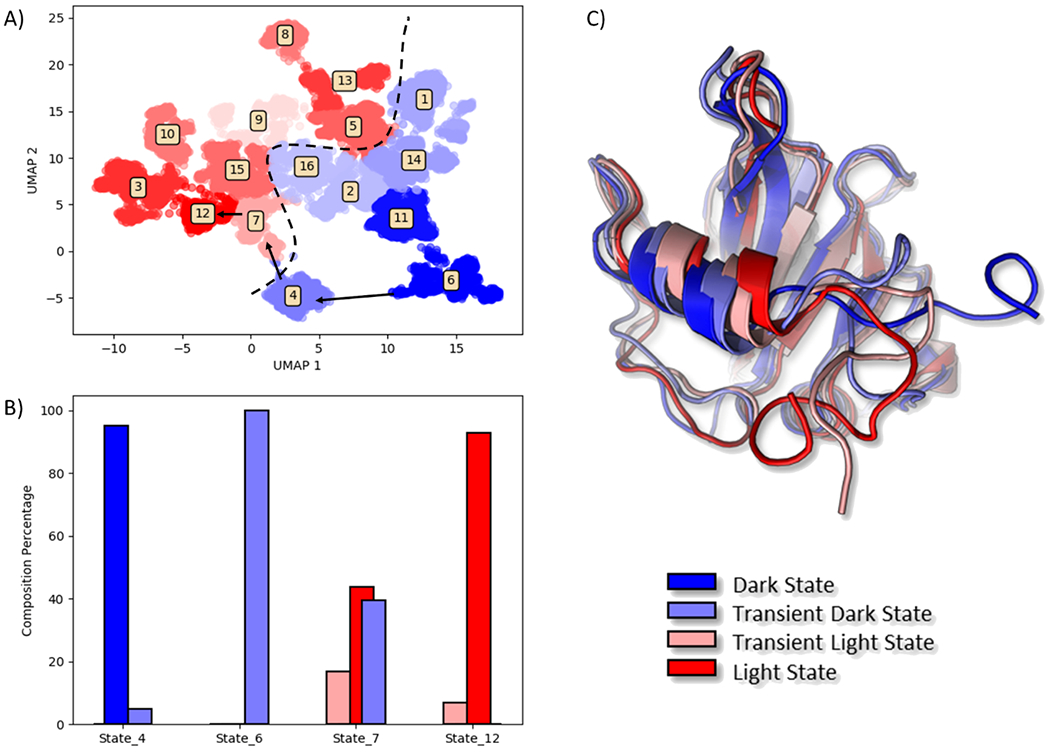
Demonstration of protein function analysis using UMAP method. A) UMAP 2D projection. Reduced space was clustered in 16 macrostates according to the criteria presented above. The clusters were color coded based on their population. Dark states are blue, and light states are red. Dashed line represents division between dark and light areas. Arrows represent pathway for allosteric conversion from fully dark to fully light states. B) Population states analysis of the macrostates involved in VVD allosteric process. C) Visualization of the four representative states involved in the allosteric process.