Figure 3.

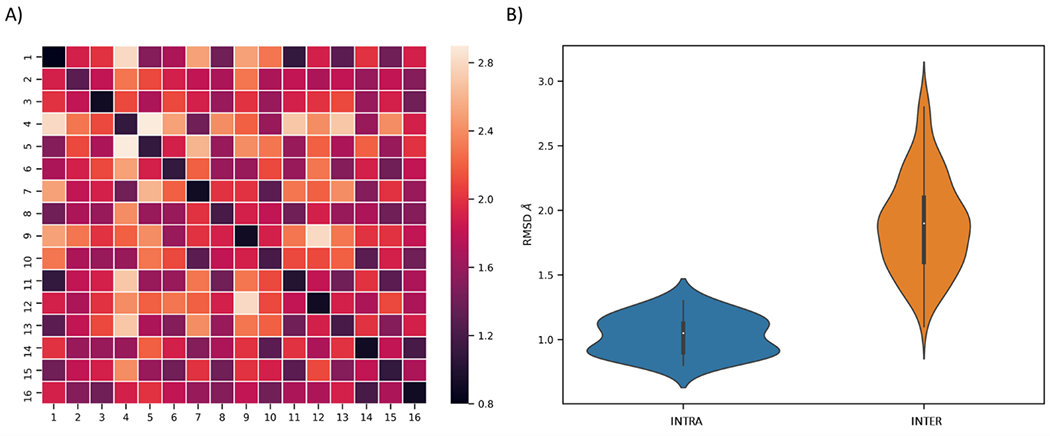
Selection of number of macrostate based on cluster RMSD. A) Heatmap of RMSD within each state. B) Violin plot of RMSD values within states (blue) and inter states (orange).

Selection of number of macrostate based on cluster RMSD. A) Heatmap of RMSD within each state. B) Violin plot of RMSD values within states (blue) and inter states (orange).