
Figure 5.
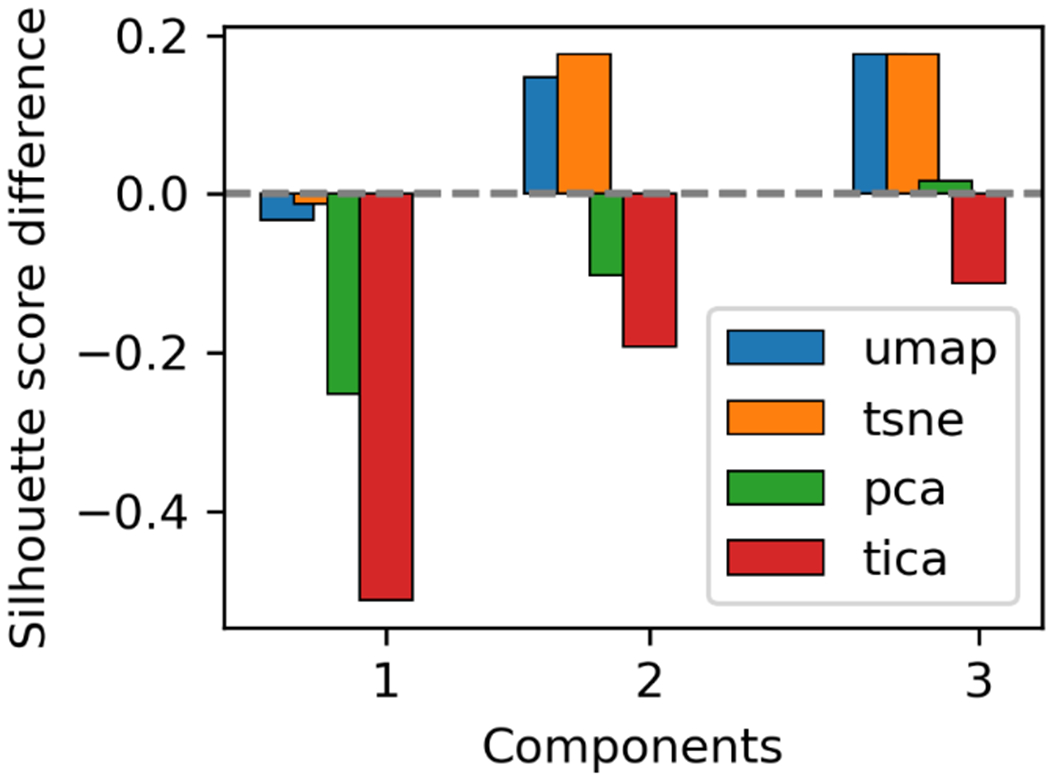
Comparison of silhouette coefficient for UMAP, t-SNE, PCA, and tICA projections vs Cartesian space results. Bar heights represent the deviation in coefficient from the Cartesian case. Positive values represent higher separation of the clusters in the projected space. Negative values represent overcrowding of the clusters in projected spaces.