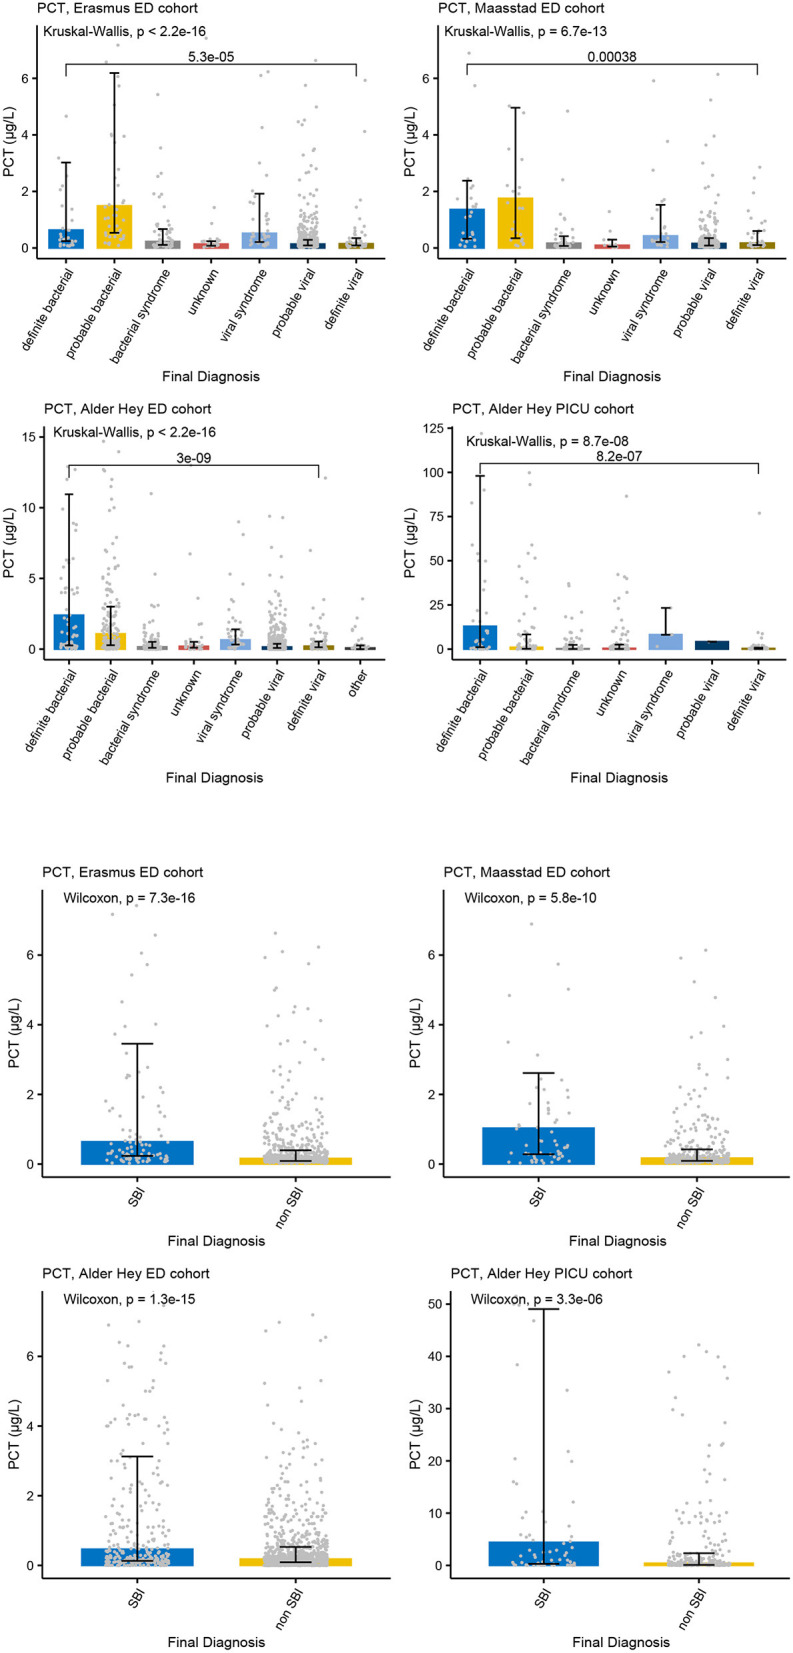
Figure 3.

PCT and serious bacterial infections. Each graph shows the concentrations of PCT (microgr/L) for each of the categories of the PERFORM classification algorithm (top two rows) and of the SBI classification algorithm (bottom two rows) in the Erasmus cohort (left, 1st and 3nd row), Maasstad cohort (right, 1st and 3rd row), Alder Hey ED cohort (left, 2nd and 4th row), and the Alder Hey PICU cohort (right, 2nd and 4th row). Each bar represents median concentration values, with the black lines representing the interquartile range, and the gray dots representing individual values. Overall significance for the PERFORM classification algorithm is given using the Kruskal Wallis test, and for the SBI classification using the Wilcoxon rank sum test. In addition, significance value for “definite bacterial” vs. “definite viral” of the PERFORM algorithm was calculated using the Wilcoxon rank sum test.
