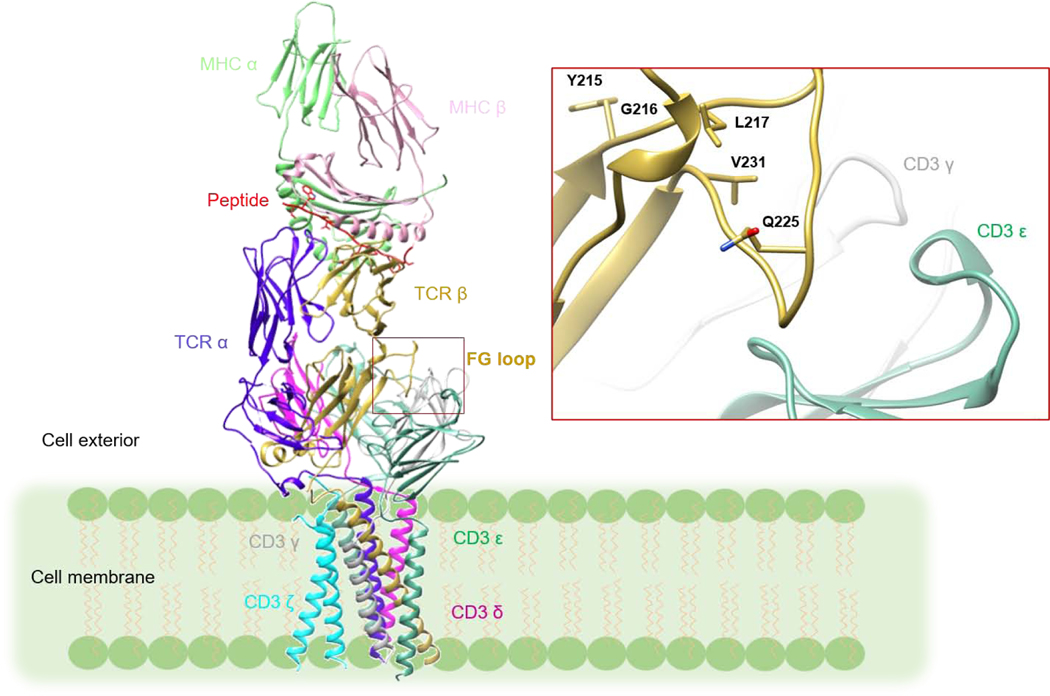
Figure 1:
Model of the TCR–CD3 complex with bound pMHC ligand. The model was constructed by superposing the crystal structure of the MS2–3C8–MBP–HLA-DR4 complex (PDB 3O6F) [23] onto the cryoEM structure of the unbound TCR–CD3 complex (PDB 6JXR) [2] through the shared Cα/Cβ domains. The inset shows a close-up view of the Cβ FG loop in the TCR–CD3 complex. The Cβ FG loop is positioned immediately above CD3εγ. The side chains of Cβ FG loop residues that undergo NMR signal perturbation in the MS2–3C8(wt)–MBP–HLA-DR4 complex (see Results) are drawn in stick representation.

