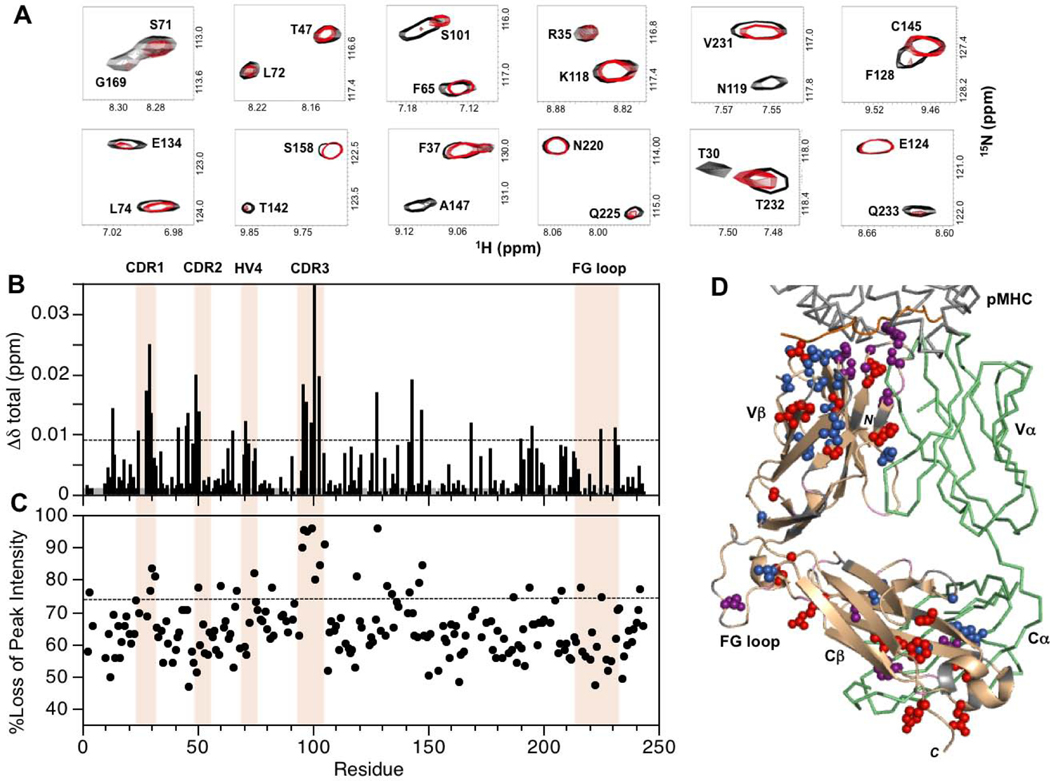
Figure 4:
Summary of backbone amide CSPs and differential peak intensity changes in the complex between MS2–3C8(mut1)α[β−2H, 15N] and MBP–HLA-DR4. (A) Expanded regions from the superimposed two dimensional 1H-15N TROSY-HSQC spectra of unbound (black) and MBP–HLA-DR4-bound (red) states of MS2–3C8(mut1)α[β−2H, 15N]. The spectrum of the bound state is scaled to match the peak intensities of most signals in the unbound state. This is done for visual purposes only to highlight the disproportional changes for specific residues upon binding. (B) Combined 1H and 15N chemical shift perturbations, Δδtotal (ppm), in the MS2–3C8(mut1) β chain versus residue number. The dashed line represents the mean value plus 1SD. Gray histogram bars indicate unassigned and proline residues. (C) Plot of percent loss of backbone amide peak intensity versus residue number. The dashed line corresponds with the mean plus 1SD. Hypervariable regions, αA, and the Cβ FG loop are highlighted in (B) and (C). (D) β chain residues in MS2–3C8(mut1) with experimentally significant changes (≥mean plus 1SD) upon binding to MBP–HLA-DR4: MS2–3C8(mut1) β chain (wheat); CSPs (blue); peak intensity changes (red); both CSP and peak intensity (purple); unassigned residues (gray); MS2–3C8(mut1) α chain (green); MBP peptide from pMHC (orange).

