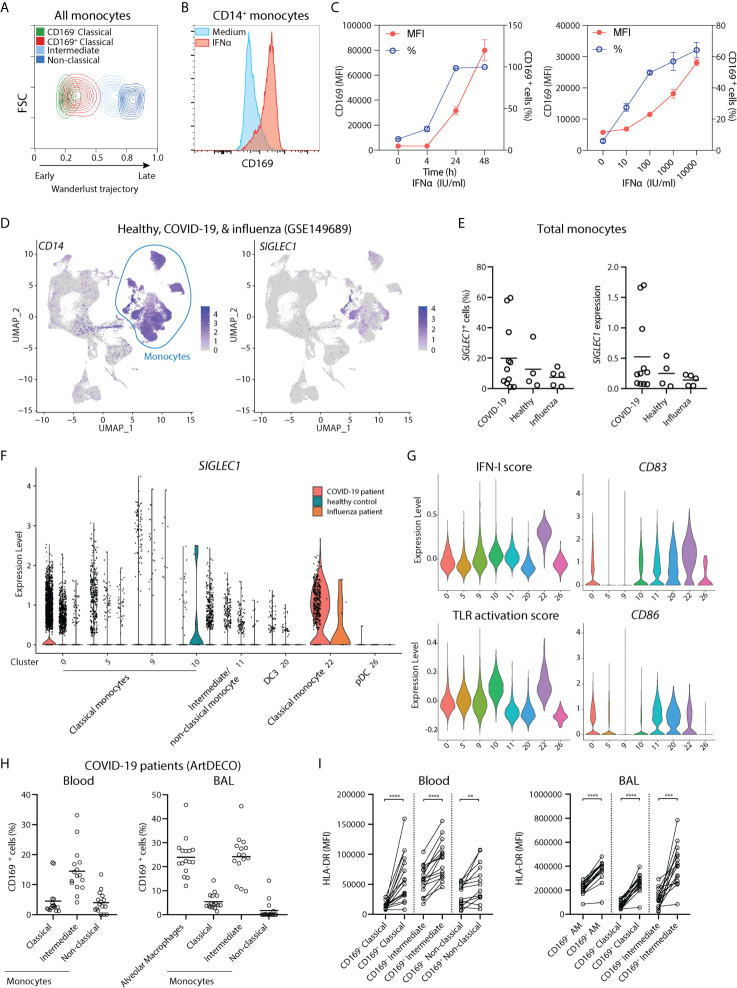
Figure 2.
CD169 expression in monocytes is driven by IFN-I and CD14+ CD169+ monocytes are present in COVID-19 patients. (A) Wanderlust trajectory analysis of monocyte population using CD14+ CD169- monocytes as starting population overlaid by conventional gating of monocyte subsets. (B, C) CD14+ monocytes were isolated and treated with 1,000 IU/ml IFNα for 24h unless indicated otherwise. Percentage of CD169+ cells or CD169 median fluorescence intensity (MFI) of CD169+ population are shown. (n = 4). (D–G) Analysis of public scRNA-seq dataset of PBMCs from patients with COVID-19 (n = 9), severe influenza (n = 5) and healthy controls (n = 4) using Seurat pipeline. (D) UMAP analysis showing the expression of CD14 and SIGLEC1. (E) SIGLEC1 expressing monocytes as shown as percentages or MFI in different groups. (F) Violin plot of SIGLEC1 expression in clusters of monocytes and DC subsets from each patient group. (G) Violin plots of IFN-I score, TLR activation score, maturation markers CD83 and CD86, in monocytes and DC clusters of all groups. (H, I) Spectral flow cytometry analysis of COVID-19 patients (ArtDECO cohort) of CD169-expressing monocytes/macrophages in circulation or bronchoalveolar space. (H) Percentage of CD169+ cells within monocytes subsets or alveolar macrophages (AM) (n = 16) in the (left panel) blood or (right panel) BALF of COVID-19 patients. (I) Expression of HLA-DR compared between CD169+ and CD169- subsets of monocytes or alveolar macrophages (AM). Paired t-tests were used. **P < 0.01, ***P < 0.001, ****P < 0.0001.

