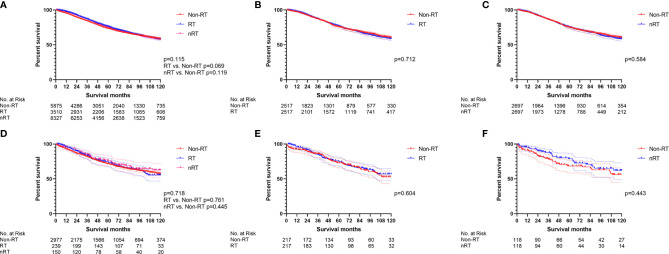
Figure 5.
The survival curves were applied to display the effect of radiotherapy in middle-aged stage II/III RC patients. All survival comparisons failed to reach statistical differences. (A) The total middle-aged stage II/III RC patients before PSM. (B) RT vs. non-RT in all middle-aged stage II/III RC patients after PSM. (C) nRT vs. non-RT in all middle-aged stage II/III RC patients after PSM. (D) Middle-aged stage II/III RC patients without chemotherapy before PSM. (E) RT vs. non-RT in middle-aged stage II/III RC patients without chemotherapy after PSM. (F) nRT vs. non-RT in middle-aged stage II/III RC patients without chemotherapy after PSM. (The results of PSM are summarized in Table S4).

