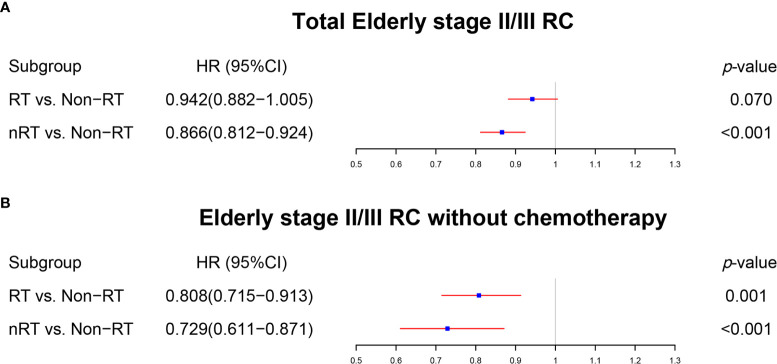
Figure 6.
The forest plot was used to show the results of the multivariable Cox regression in elderly stage II/III RC. (A) RT vs. non-RT and nRT vs. non-RT in total elderly stage II/III RC patients. (B) RT vs. non-RT and nRT vs. non-RT in elderly stage II/III RC patients without chemotherapy. (The results were extracted from Table S5).

