. 2021 Jul 2;12(31):10558–10582. doi: 10.1039/d1sc01908b

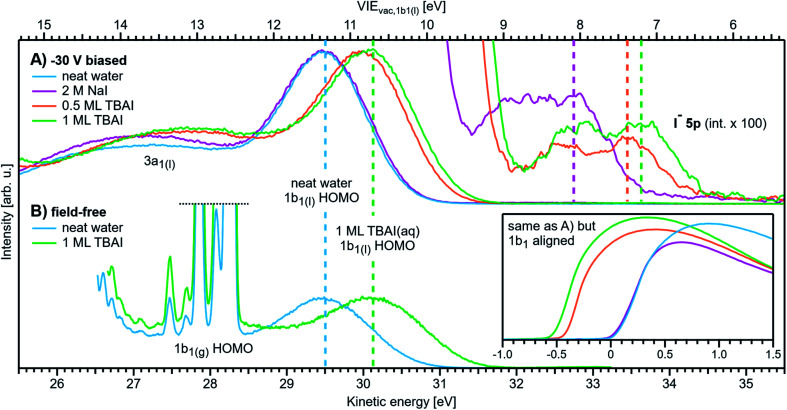
Fig. 5. Changes in VIEvac,1b1 for representative aqueous solutions, both with an applied bias and a grounded jet. All spectra were recorded with He II α emission ( = 40.814 eV). (A) Spectra measured with a bias voltage of −30 V. Each cutoff position was then aligned to eKE = 0 eV, which immediately visualizes VIEvac changes as shifts of the liquid 1b1 HOMO position; the top axis shows the corresponding VIEvac,1b1(l) energy scale. The bottom-right inset shows the same spectra aligned to the 1b1 HOMO position, which instead show a shift in the cutoff position; both presentations are equivalent. Neat water serves as a reference position (blue line; about 50 mM NaCl was added here, but the precise value is irrelevant for this method). All spectra are normalized to the same 1b1 peak height. The spectra are shown multiplied by a factor of 100 (and smoothed with a 5-point boxcar averaging) to reveal the I 5p solute feature to the top-right. The position of the 5p3/2 peak is marked with a dashed line in each case. (B) Spectra measured with a grounded jet. The salt concentration for the (nearly) neat water spectrum (blue line) was precisely tuned to achieve field-free conditions (2.5 mM NaCl was optimal here). The spectra are aligned so that the 1b1 position of neat water is matched with (A). The same shift is observed with 1 monolayer (ML) TBAI (green line) as in A, which shows the equivalence of Methods 1 and 2. Here, TBAI aqueous solution serves as a special case, where the field-free condition is preserved even for the solution, which makes a direct comparison possible in the first place. In general, the solutions and delivery conditions generate non-zero extrinsic and intrinsic potentials which impose an unknown additional energy shift to the liquid spectra.

Fig. 5