. 2021 Jul 2;12(31):10558–10582. doi: 10.1039/d1sc01908b

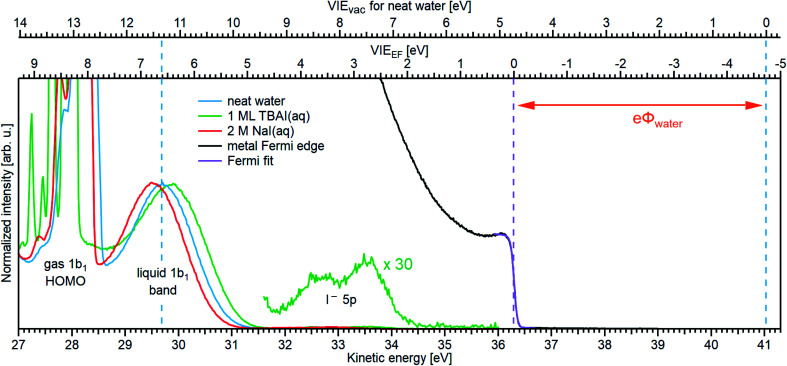
Fig. 6. Determination of VIEEF,1b1(l) for neat water (blue, with an optimal NaCl concentration of 50 mM; see the main body of the text for details) and the limitations of this method for aqueous solutions, exemplified here for 1 ML TBAI(aq) (green) and 2 M NaI(aq) (red) solutions. The relative energy position of liquid water's lowest energy 1b1 ionization feature and the Fermi edge of a metallic reference sample were separately recorded using He IIα emission ( = 40.814 eV). A sample bias was not applied in either case and the bottom axis shows the as-measured kinetic energy scale of the detector. To the right, the highest eKE feature of the metal spectrum is shown in black (only the Fermi edge is visible). The position and spectral shape of the measured metal spectrum was unchanged following the introduction of the LJ and solution. The Fermi edge was fit with a Fermi function23 (purple line), and its position defines the zero point of the VIEEF energy scale in the spectrum (lower axis scale at the top of the panel). This enables us to determine the VIEEF,1b1(l) value of 6.60 ± 0.08 eV and a eΦwater value of 4.73 ± 0.09 eV for (almost) neat water. For the 2 M NaI(aq) solution, the 1b1 peak is shifted towards lower eKEs (higher VIEEF), which most likely arises from additional extrinsic fields as opposed to a real change of the aqueous electronic structure for this solution (compare to Fig. SI-7); the VIEvac values underwent insignificant changes in going from neat water and 2 M NaI(aq) solutions (compare to Fig. 5). Without proper assessment of additional potentials, such as the streaming potential or surface charge, it is in principle impossible to accurately reference eKEs to EF or judge associated changes in VIEEF in this case. In the case of TBAI(aq), on the other hand, the 1b1 shifts towards higher eKEs (lower VIEEF). It can be argued that this shift is caused by band-bending at the liquid interface (see text for details). Multiplying the TBAI(aq) spectrum by a factor of 30 reveals the I 5p solute features around eKE ≈ 33 eV, corresponding to VIEEF values of 3.80 ± 0.10 eV and 2.84 ± 0.10 eV for the 5p1/2 and 5p3/2 levels, respectively.

Fig. 6