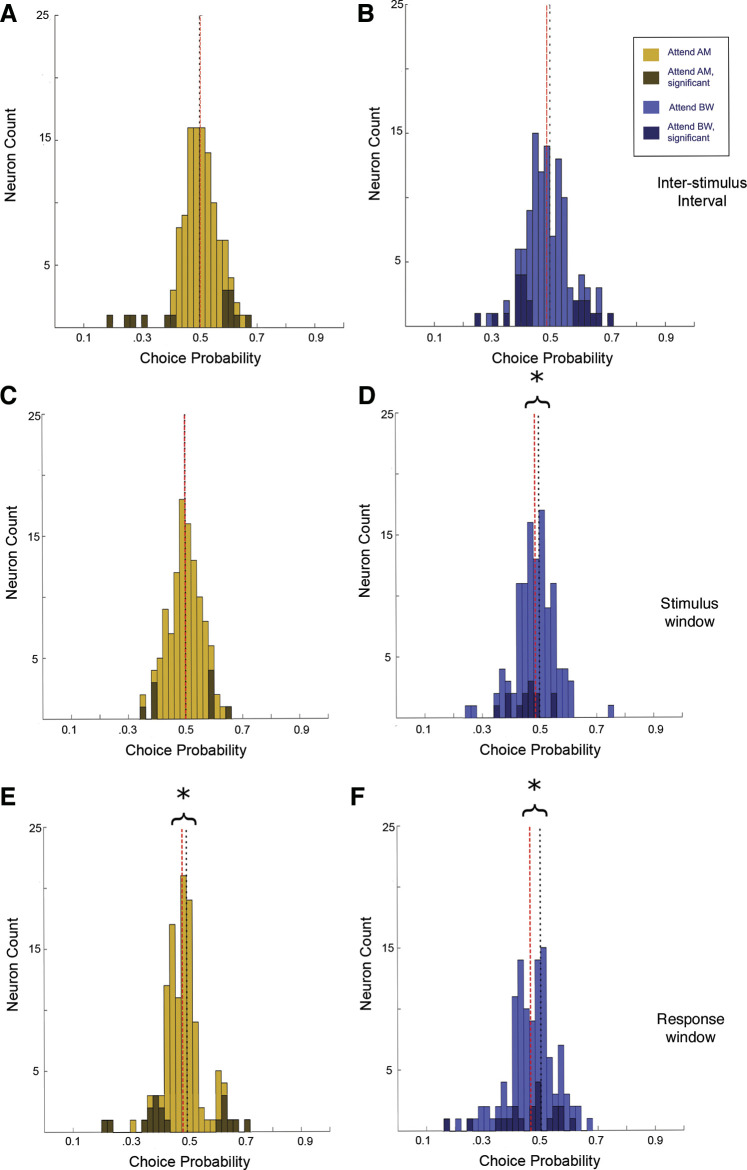
Figure 13.
Choice probability in ML neurons (n = 122), as in Fig. 12. A and B: CP during the ISI window was centered about 0.5 for both the attend AM condition (A; median = 0.50, P = 0.47, signed-rank test) and the attend BW condition (B; median = 0.49, P = 0.15, signed-rank test). CP during the attend AM condition is evenly distributed about 0.5 in the stimulus window (C; median = 0.50, P = 0.94, signed-rank test). However, in the response window E, CP values tended to be less than 0.5 (median = 0.48, P = 0.004, signed-rank test). In the attend ΔBW condition, CP values tended to be less than 0.5 in both the stimulus window (D; median = 0.49, P = 0.043 signed-rank test) and the response window (F; median = 0.47, P = 2.7 e-5 signed-rank test). As in A1, there was a significant difference in the population CP distributions between attention conditions during the RW (P = 0.033, signed-rank test), though not during the S2 (P = 0.15, signed-rank test). AM, amplitude modulation; A1, primary auditory cortex; BW, bandwidth; CP, choice probability; ISI, interstimulus interval; ML, middle lateral belt; RW, response window; S2, second sound; ΔBW, bandwidth restricted. *indicates population median significantly different than 0.5, P < 0.05, signed-rank test.

