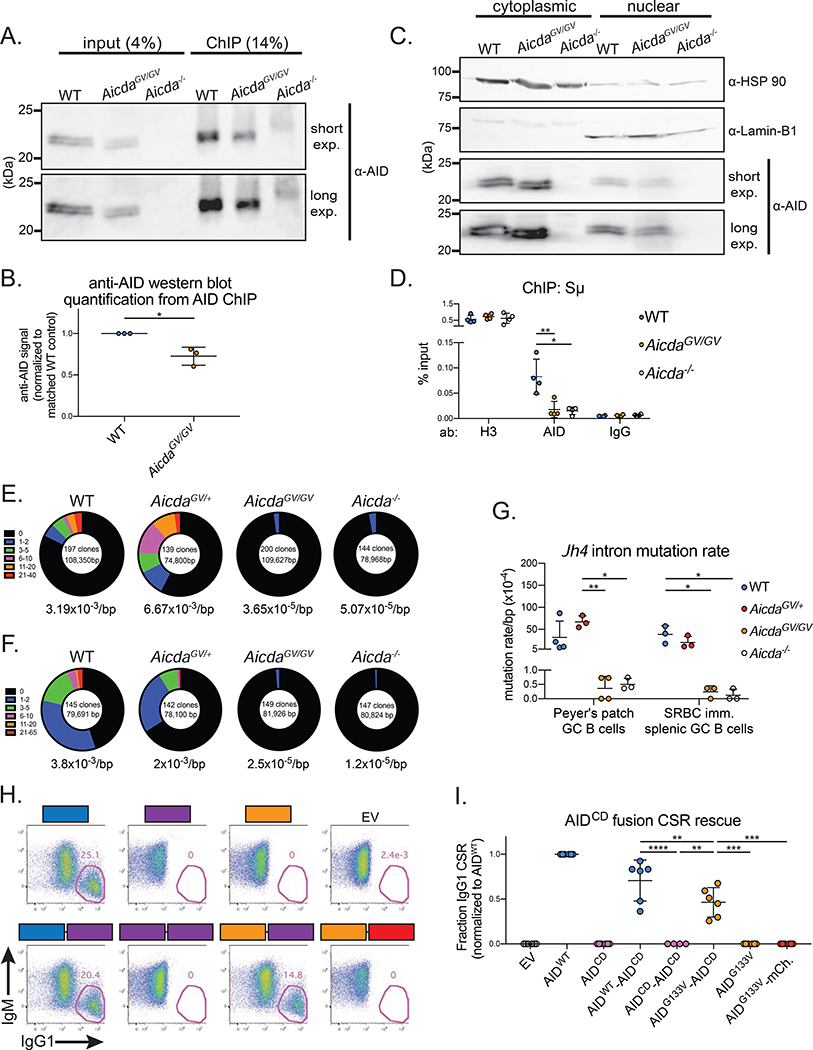
Figure 5. AIDG133V has impaired Igh targeting.
(A) Representative immunoblot showing AID immunoprecipitation during ChIP protocol, fraction of total lysate loaded is indicated. Exp, exposure. (B) Quantification of data shown in (A). (C) Representative immunoblots from nuclear-cytoplasmic fractionation experiments. Cytoplasmic loading control, HSP 90; nuclear loading control, Lamin-B1. (D) ChIP qPCR quantifying the amount of Sμ DNA immunoprecipitated with indicated antibodies (ab) from various genotypes. (E-G) Analysis of somatic hypermutation within the Jh4 intron. Germinal center (GC) B cells were sorted from Peyer’s patches at homeostasis (E), or the spleen at d7 post-SRBC immunization (F), and Jh4 intron sequences were cloned and sequenced. Total number of clones and total base pairs (bp) analyzed indicated inside circles, average mutation frequency indicated below circles, fraction of clones with the indicated number of mutations represented as section of circle. (G) Quantification of data in (E,F). (H) Representative gates from retroviral rescue of CSR in Aicda−/− B cells. Aicda−/− B cells were infected with retroviruses expressing GFP only (empty vector, EV), wild type AID (AIDWT), AIDG133V, catalytically dead AIDH56R/E58Q (AIDCD), or AIDWT-AIDCD, AIDG133V-AIDCD, AIDCD-AIDCD, and AIDG133V-mCherry fusions. Cells were stimulated with LPS plus IL-4, and IgG1 CSR was quantified as a frequency of live infected cells (GFP+) at 96 hrs post-stimulation. (I) Quantification of data shown in (H), raw CSR values shown in Table S1. Data in (A,B) are representative of 3 independent experiments with 1 mouse per genotype, (C) are representative of 2 independent experiments with 2 mice per genotype, (D) are from 4 independent experiments with 1 mouse per genotype, (E,F) are from 1 experiment with 3–4 mice per genotype, (H,I) are from 2 or 3 independent experiments with 1 or 2 mice per experiment. AicdaGV/GV, AicdaG133V/G133V. Error bars represent the mean ± std. dev. *p < 0.05; **p < 0.01; ***p < 0.001; ****p < 0.0001. p-values calculated using a paired (B,I) or unpaired (G) t-test.

