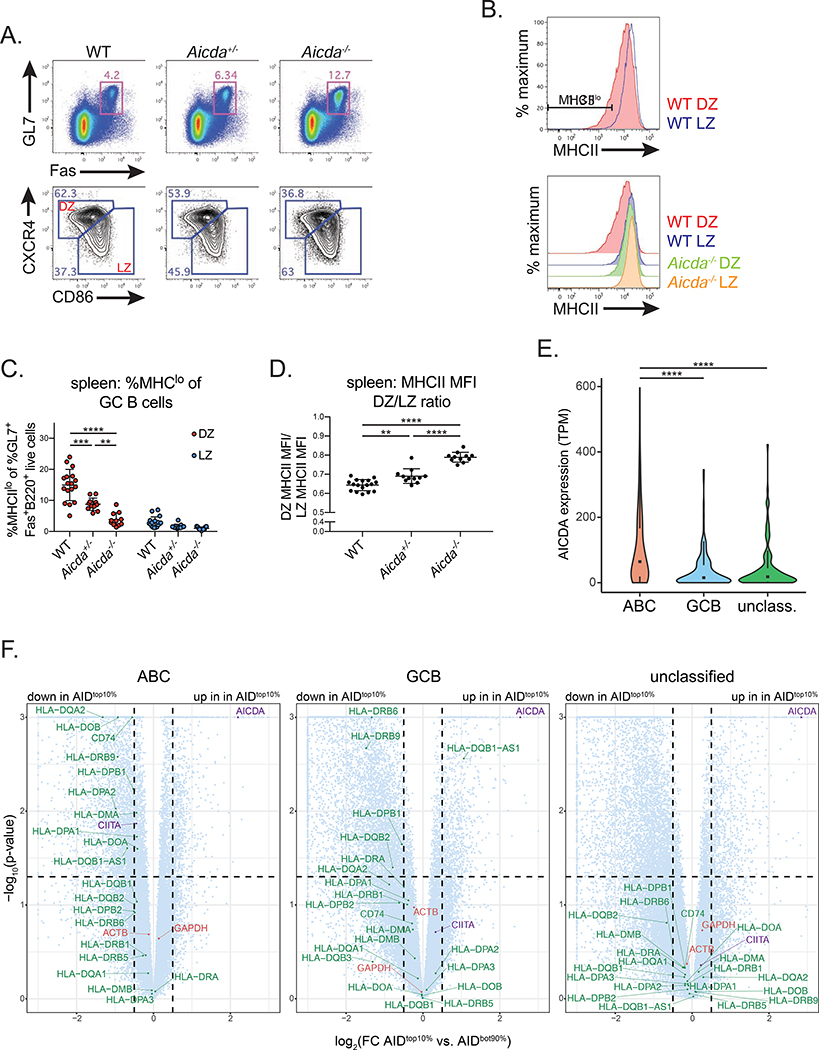
Figure 7. AID expression correlates with decreased MHCII expression in mouse GC B cells and human DLBCL.
(A-D) MHCII expression in germinal center (GC) B cells. Mice were immunized intraperitoneally with UV-inactivated influenza A virus and analyzed at d12 post-immunization. (A) Representative GC B cell gates (GL7+Fas+ of B220+ live cells) (top), and GC dark zone (DZ) (CXCR4hiCD86lo of GL7+Fas+B220+ live cells) and light zone (LZ) (CXCR4loCD86hi of GL7+Fas+B220+ live cells) gates (bottom) in the spleen (Quantified in Figure S6A,B). (B) Representative histograms depicting MHCII surface staining in LZ and DZ GC B cells, and representative MHCIIlo gate (%MHCIIlo of DZ or LZ GC B cells). (C) Quantification of MHCIIlo frequency within DZ and LZ GC B cells. (D) Quantification of MHCII MFI ratio, calculated as DZ MHCII MFI/LZ MHCII MFI (MFI values quantified in Figure S6F). (E) Violin plots depicting AICDA expression values within activated B cell-like (ABC), germinal center B cell-like (GCB), or unclassified human diffuse large B-cell lymphoma (DLBCL) tumors. Box and whiskers plot displayed inside; TPM, transcripts per million. (F) Volcano plots depicting RNA-seq data, analyzed as TPM, from ABC, GCB or unclassified human DLBCL tumors. Log2 fold change (top 10% of AID expressing samples (AIDtop10%) versus the bottom 90% (AIDbot90%)) shown on the x-axis and –log10 (p-value) on the y-axis. Circles represent genes plotted within boundaries; triangles represent genes that are off the axis, plotted at the nearest point within the boundaries. Green, MHCII genes; red, control genes; purple, AICDA and CIITA. Dotted lines mark p-value = 0.05 and log2(fold change) = ± 0.5. Scatter plots correlating AICDA and MHCII expression, analyzed as transcripts per million (TPM), shown in Figure S7. Data in (A-D) are from 3 independent experiments with 2–6 mice per genotype. Error bars represent the mean ± std. dev. **p < 0.01; ***p < 0.001; ****p < 0.0001. p-values calculated using a one-way ANOVA with Tukey’s multiple comparisons test (C-E), or from DEseq analysis (F) (see methods for details).

