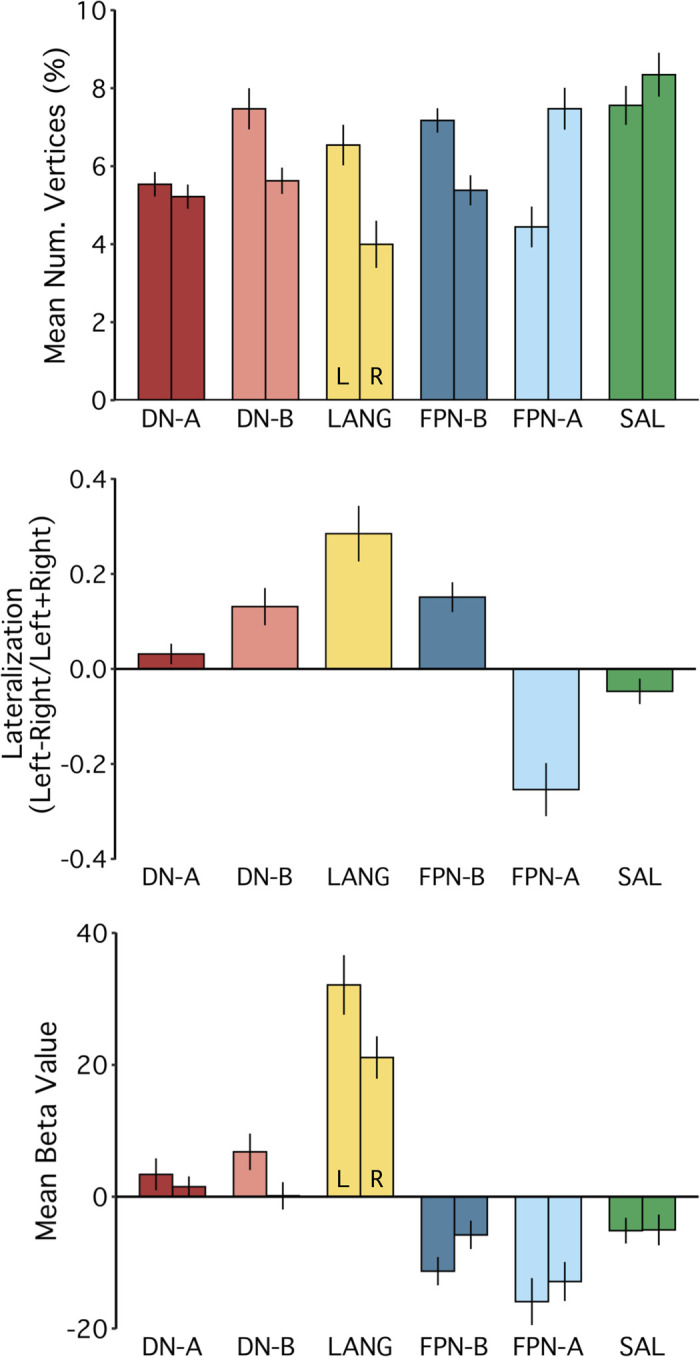
Fig. 21.

The language network is left lateralized on average in the group. Composite analyses were conducted using all 18 subjects from the original, replication, and triplication cohorts (studies 1–4). Group means are plotted in each panel, with standard error of the mean. Top: %total vertices in the left (L) and right (R) hemispheres included in each of the 6 a priori networks was calculated as a proxy for the relative size or surface area occupied by each network. The language network (LANG) showed larger regions on the left compared with right hemispheres, as did default network B (DN-B) and frontoparietal control network B (FPN-B). Default network A (DN-A) and the salience network (SAL) showed no or limited evidence of consistent lateralization. Frontoparietal control network A (FPN-A) showed a consistent right-lateralized pattern. Middle: direct comparison of the relative size of network regions in each hemisphere revealed that, on average, the LANG network was the most left lateralized of the networks tested. The lateralization metric computed was the number of network vertices in the left hemisphere minus the number of network vertices in the right divided by the total number of network vertices in both hemispheres. Positive values denote left lateralization, and negative values denote right lateralization. Bottom: the group mean β-value for the contrast of reading sentences vs. lists of pronounceable nonwords was calculated for vertices falling within each a priori network, separated by hemisphere. Despite differences in the relative size of LANG network regions in each hemisphere, robust evidence for activation in both hemispheres was observed, with left hemisphere regions showing higher levels of activity.
