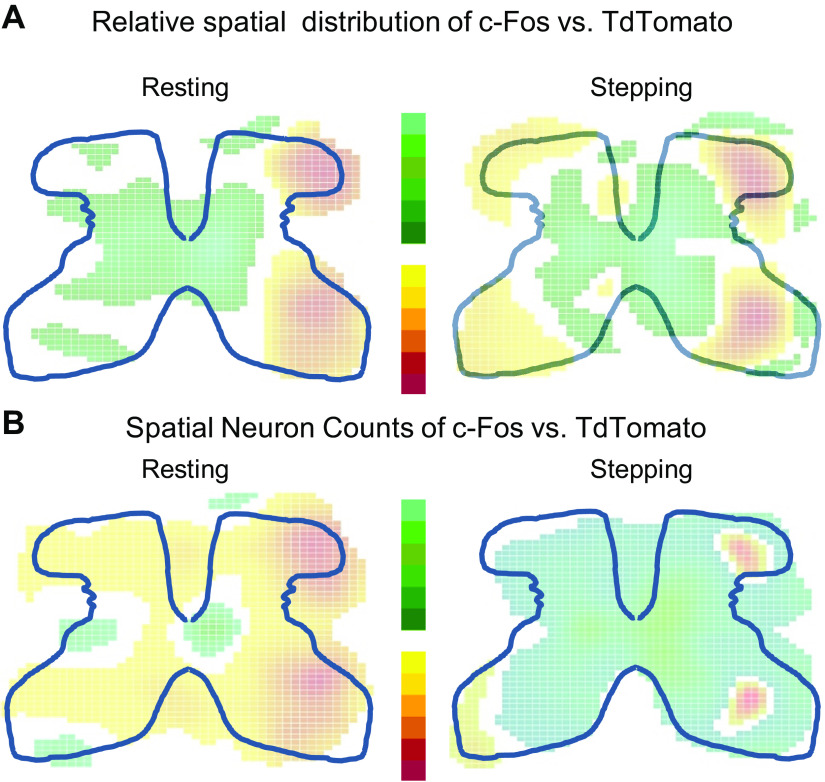
Fig. 4.
Differences in spatial distribution and counts of c-Fos and tdTomato when activated by resting or stepping. A: map of the differences in spatial distribution between c-Fos and tdTomato during resting or stepping calculated from KDEs shown in Fig. 2 and Supplemental Fig. S2. B: map of the differences in spatial counts between c-Fos and tdTomato during resting or stepping calculated from KDEs shown in Fig. 2 and Supplemental Fig. S3. For both A and B, green represents areas where c-Fos is significantly higher and red represents areas where tdTomato is significantly higher. White represents areas of no significant differences. Statistical significance was determined through resampling techniques in which a 95% confidence interval was created (see Methods). KDE, kernel density estimate.

