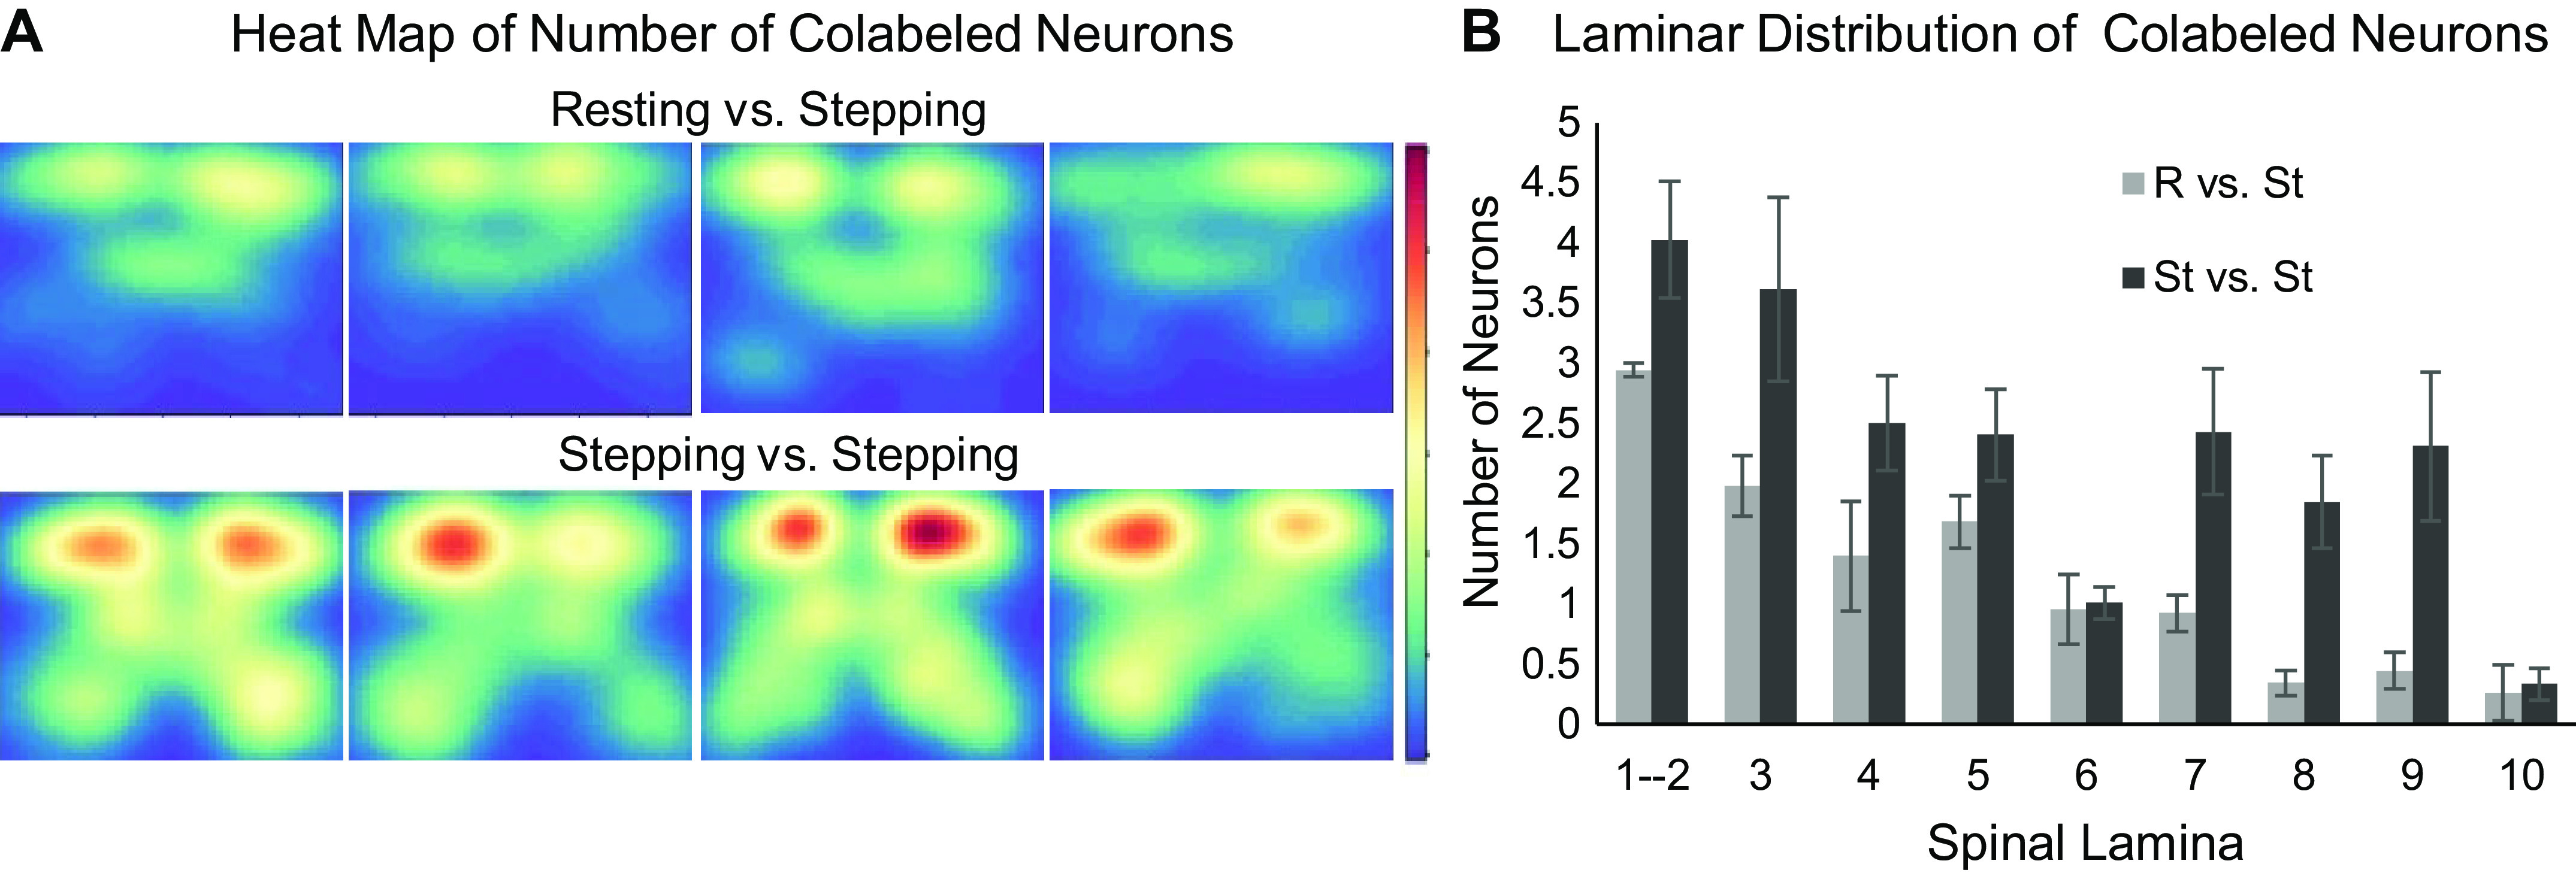
Fig. 5.

Distribution and counts of colabeling. A: spatial count heat maps of colabeled neurons in the resting versus stepping (R vs. St) and stepping versus stepping (St vs. St) experimental groups. Red labels areas with higher neuronal counts, and blue labels areas with lower neuronal counts. B: histogram of colabeling number of neurons by spinal laminae.
