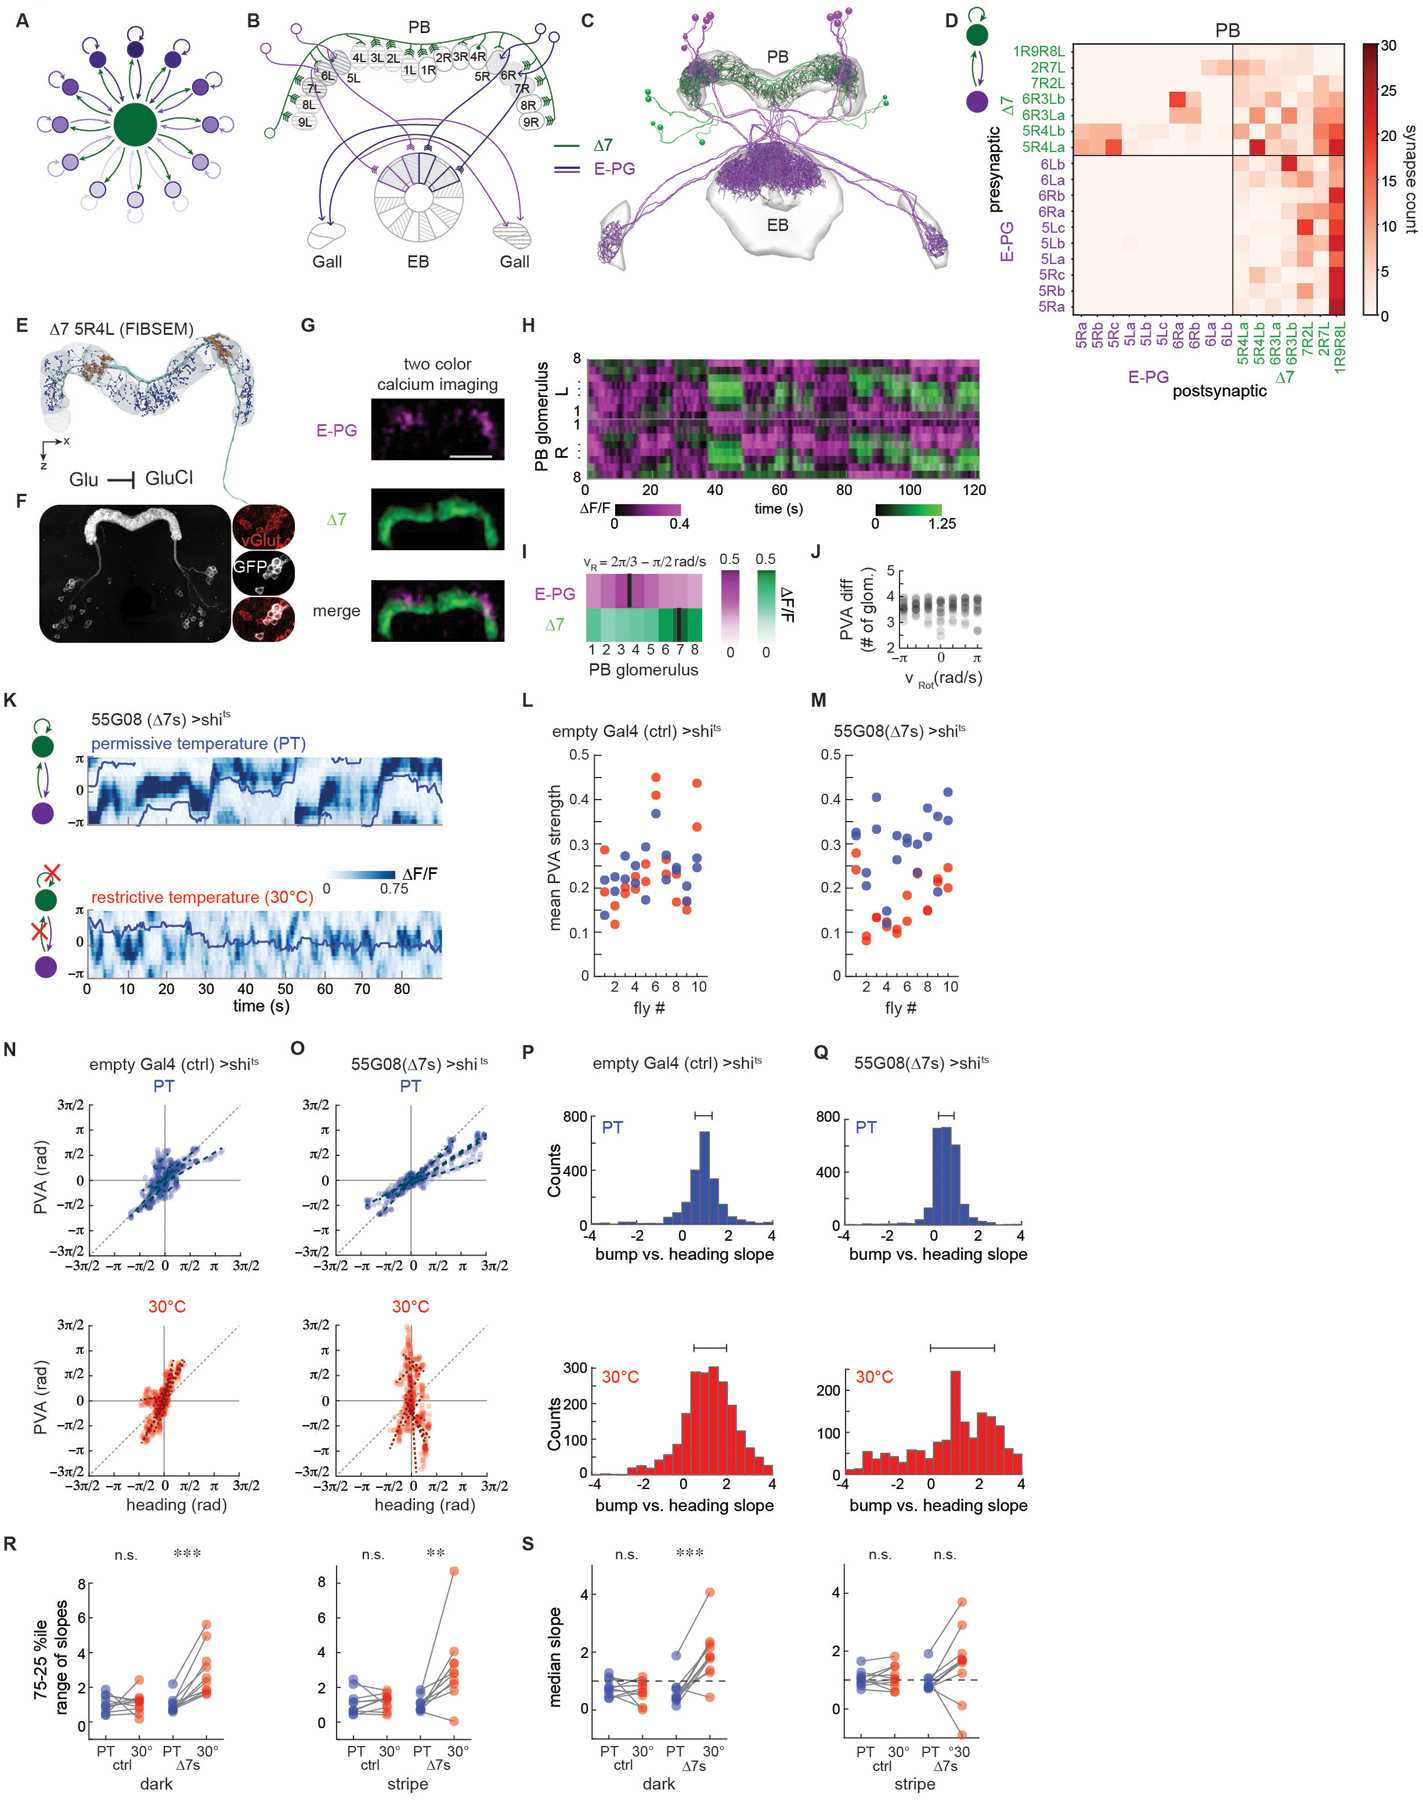
Figure 4: Long-range inhibition from Δ7s is required to stabilize the E-PG activity bump.

A. Long-range inhibition helps maintain a single bump of activity (dark purple).
B. Schematic depicting a subset of the E-PG and Δ7 neurons corresponding to those traced (Figure 4C). Gray shading shows areas of PB and EB in which the neurons were traced. Note that Δ7s were also partially traced in other PB glomeruli to enable identification. Note that —in contrast to the schematized inhibition in A— Δ7 neurons do not synapse onto the E-PG neurons that they themselves receive input from.
C. Putative excitatory (purple, E-PGs) and inhibitory (green, Δ7s) neurons were traced and their synapses onto one another in the PB annotated.
D. Connectivity matrix within the protocerebral bridge (PB) for the E-PGs and Δ7s. The Δ7s synapse onto the subset of E-PGs within one glomerulus in the PB (5R→5R, 6R→6R, upper left quadrant) and receive broad input from the E-PGs away from that region (last column, lower right quadrant). The Δ7s synapse onto one another (upper right quadrant).
E. A single Δ7 neuron reconstruction (green) from the FIBSEM hemibrain connectome. Blue (postsynaptic) and orange (presynaptic) dots highlight synapses. Note that presynaptic specializations are localized to PB glomeruli separated by seven intermediate glomeruli (in this case, 5R and 4L).
F. Fluorescent in situ hybridization (FISH) of vGlut showed consistent overlap between GFP labeled Δ7s (white) and vGlut positive cells (red) (3/3 brains for the SS30295 genetic line and 2/2 brains for the SS02238 genetic line). (right) Glutamate release can lead to hyperpolarization of a downstream partner through GluCl channels.
G. Two-color calcium imaging was performed on the E-PGs (magenta) and the Δ7s (green) to record the simultaneous activity of the two populations. Here, GCaMP6f was expressed in the Δ7s and jRGECOla was expressed in the E-PGs.
H. The PB activity of both populations over time for the fly shown in I. The right and left PB were each divided into eight regions of interest (ROI), each corresponding to one glomerulus. The change in fluorescence intensity, ΔF/F, was then calculated for each ROI over time.
I. At each point in time, the red and green activity profiles were circularly shifted by the same number of ROIs in order to consistently place the peak of red activity at ROI #4. The mean registered activity in the right half of the PB across all time points when the fly in H was rotating at between 2π/3 and π/2 rad/s is shown.
J. The PVA difference between E-PG and Δ7 activity as a function of rotational velocity, vRot. Data from 10 flies is shown, with both the right and left PB included. In 5 flies, GCaMP6f was expressed in the Δ7s and jRGECO1a was expressed in the E-PGs, while 5 flies had the reverse indicator expression pairing.
K. E-PG calcium activity in the ellipsoid body recorded with GCaMP6f in flies expressing shits in the Δ7s (line 55G08) at permissive (top) and restrictive temperatures (bottom). The fly was presented with a stripe in closed loop over the course of the trial, and its position over time is indicated by the blue line.
L. In control flies, E-PG PVA strength at the permissive temperature (blue dots) and at the restrictive temperature (red dots) does not differ significantly (p = 0.98, paired t-test).
M. E-PG PVA strength is reduced at the restrictive temperature when vesicle reuptake is blocked at Δ7 synapses (p = 2.8E-6, paired t-test).
N. For 5 s sliding windows (see STAR Methods), the fly’s position (heading) is plotted vs. the bump position (PVA). Blue dots indicate trials at the permissive temperature and red dots indicate trials at the restrictive temperature. Heading vs. PVA for 10 representative windows from an example control fly at the permissive (top) and restrictive (30 °C,bottom) temperatures. Each dotted line is a linear fit to the points within one window
O. Heading vs. PVA for an example fly expressing shits in the Δ7s at the permissive (blue dots, top) and restrictive (red dots, bottom) temperatures.
P. The slope of the points in 5 s sliding windows. The two plots shown here are for flies expressing GCaMP6f in the E-PGs and shits in empty Gal4 controls. The top plot shows a histogram of the slopes across two room temperature trials. The bottom plot shows a histogram of the slopes across three high temperature trials. The 25th and 75th percentiles are indicated above.
Q. As in Figure 4P, but now for flies expressing shits in the Δ7s.
R. The range of slopes between the 25th and 75th percentiles, as obtained from the histogram of slopes, for the flies expressing shits in empty Gal4 (ctrl) and the Δ7s. (left) The percentile range when the flies are in the dark. (right) The percentile range when the flies are tracking a closed loop stripe. Trials at the permissive temperature are in blue; trials at the restrictive temperature are in red. From left to right, p = 0.83, 4.8E-4, 0.78, and 9.7E-3 (paired t-test).
S. The median slope for the control flies in the dark (left) and with a stripe (right) for the room temperature trials (blue) and high temperature trials (red). From left to right, p = 0.61, 3.5E-4, 0.55, and 0.13 (paired t-test).
