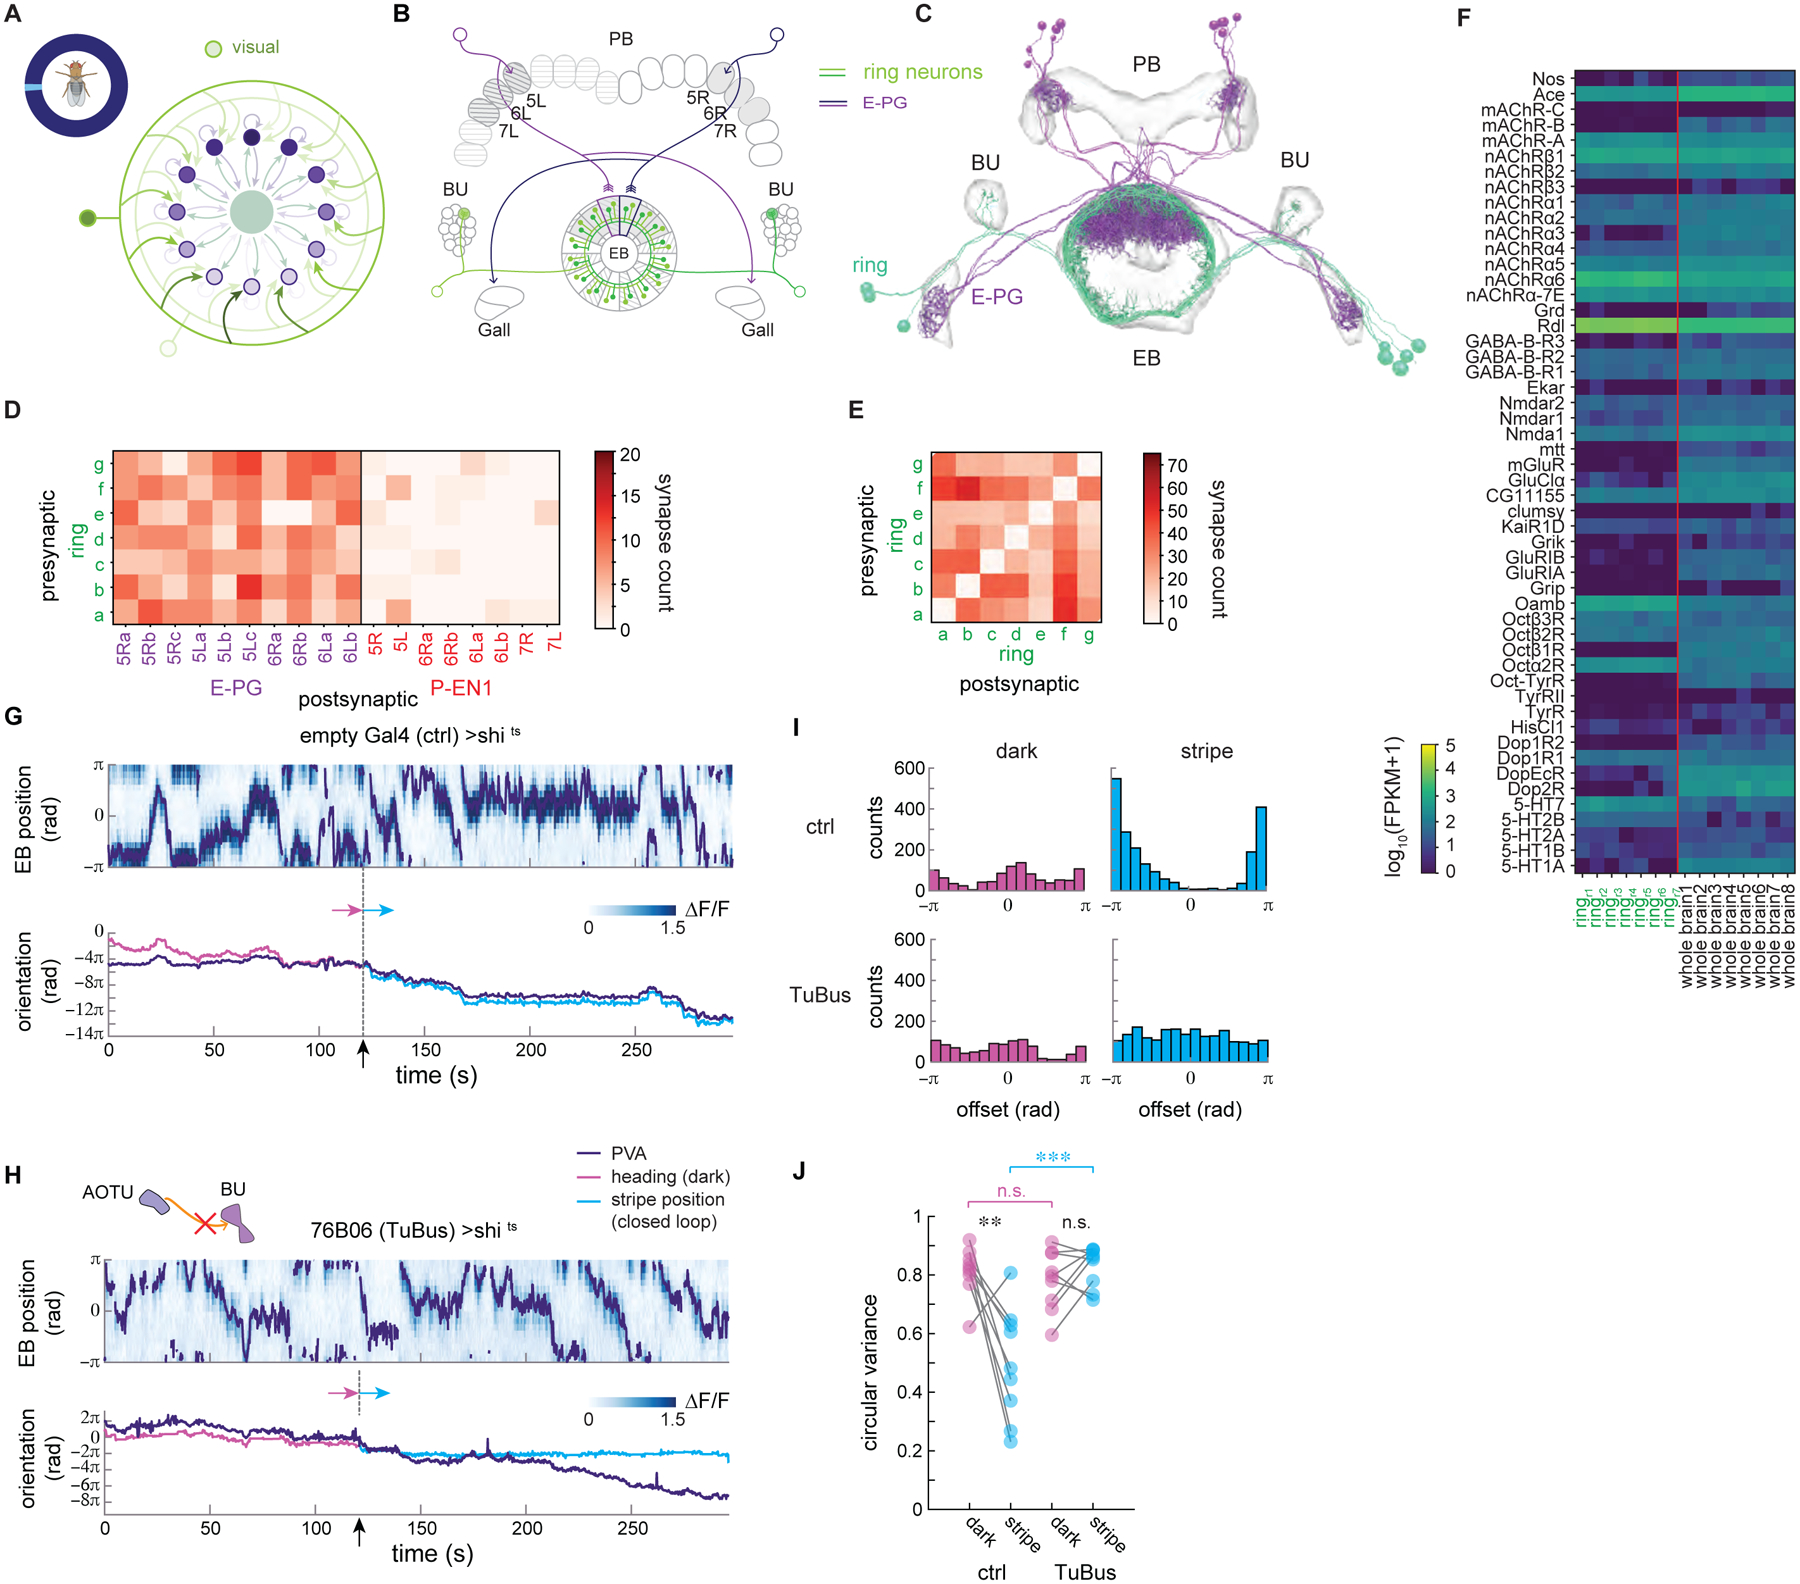
Figure 6: Mutually inhibitory R4d ring neurons synapse onto the E-PGs, tethering the bump to visual cues.

A. Visual inputs (light green) map the visual scene onto the compass bump (dark purple) (see Figure 1E, 1F for details).
B. Schematic displaying ring neurons making synaptic contacts onto E-PGs in the EB. EB wedges and PB glomeruli selected for E-PG reconstruction (Figure 6C) are in gray.
C. R4d neurons (light green) were traced and their synapses onto each other and onto E-PG neurons (purple) were annotated.
D. Connectivity matrix between the E-PGs, P-EN1s, and ring neurons in the EB. This data is reproduced from Figure 2E.
E. Connectivity matrix between ring neurons in the EB. This data is reproduced from Figure 2E.
F. mRNA expression of receptor-linked genes for the ring neurons and whole brain tissue. Subscripts r1–r7 refer to biological replicates, each of which uses the same genetic line to target the R4d ring neurons.
G. (top) An example of E-PG EB activity over time for control flies at the restrictive temperature. The PVA is overlaid in purple. (bottom) Unwrapped PVA, heading in the dark, and stripe position over time. For the first 120 s, the fly is in darkness (heading shown in pink). For the final 150 s, the fly sees a stripe in closed loop (stripe position shown in light blue).
H.An example of E-PG EB activity for flies expressing shits in the TuBu neurons at the restrictive temperature. Compare E-PG bump locking to visual cue movement when the fly is walking in closed loop with a stripe against that seen at permissive temperature (Figure 6G).
I. The offset between PVA and heading is calculated at each time point for the trials shown in Figure 6G and 6H, binned, and plotted here.
J. The circular variance for the offset distribution across flies in the dark and when a closed-loop stripe is present (p = 4.9E-3, 0.23 (paired t-test)). Mean of the circular variance is not significantly different between the control and TuBu flies in the dark (p = 0.69, two-sample t-test across genotypes). Circular variance between the control and TuBu flies is however significantly different in the presence of a stripe in closed loop (p = 2.9E-4, two-sample t-test across genotypes).
