
Figure 7: P-EG and P-EN2 neurons together create a second recurrent loop with E-PGs.
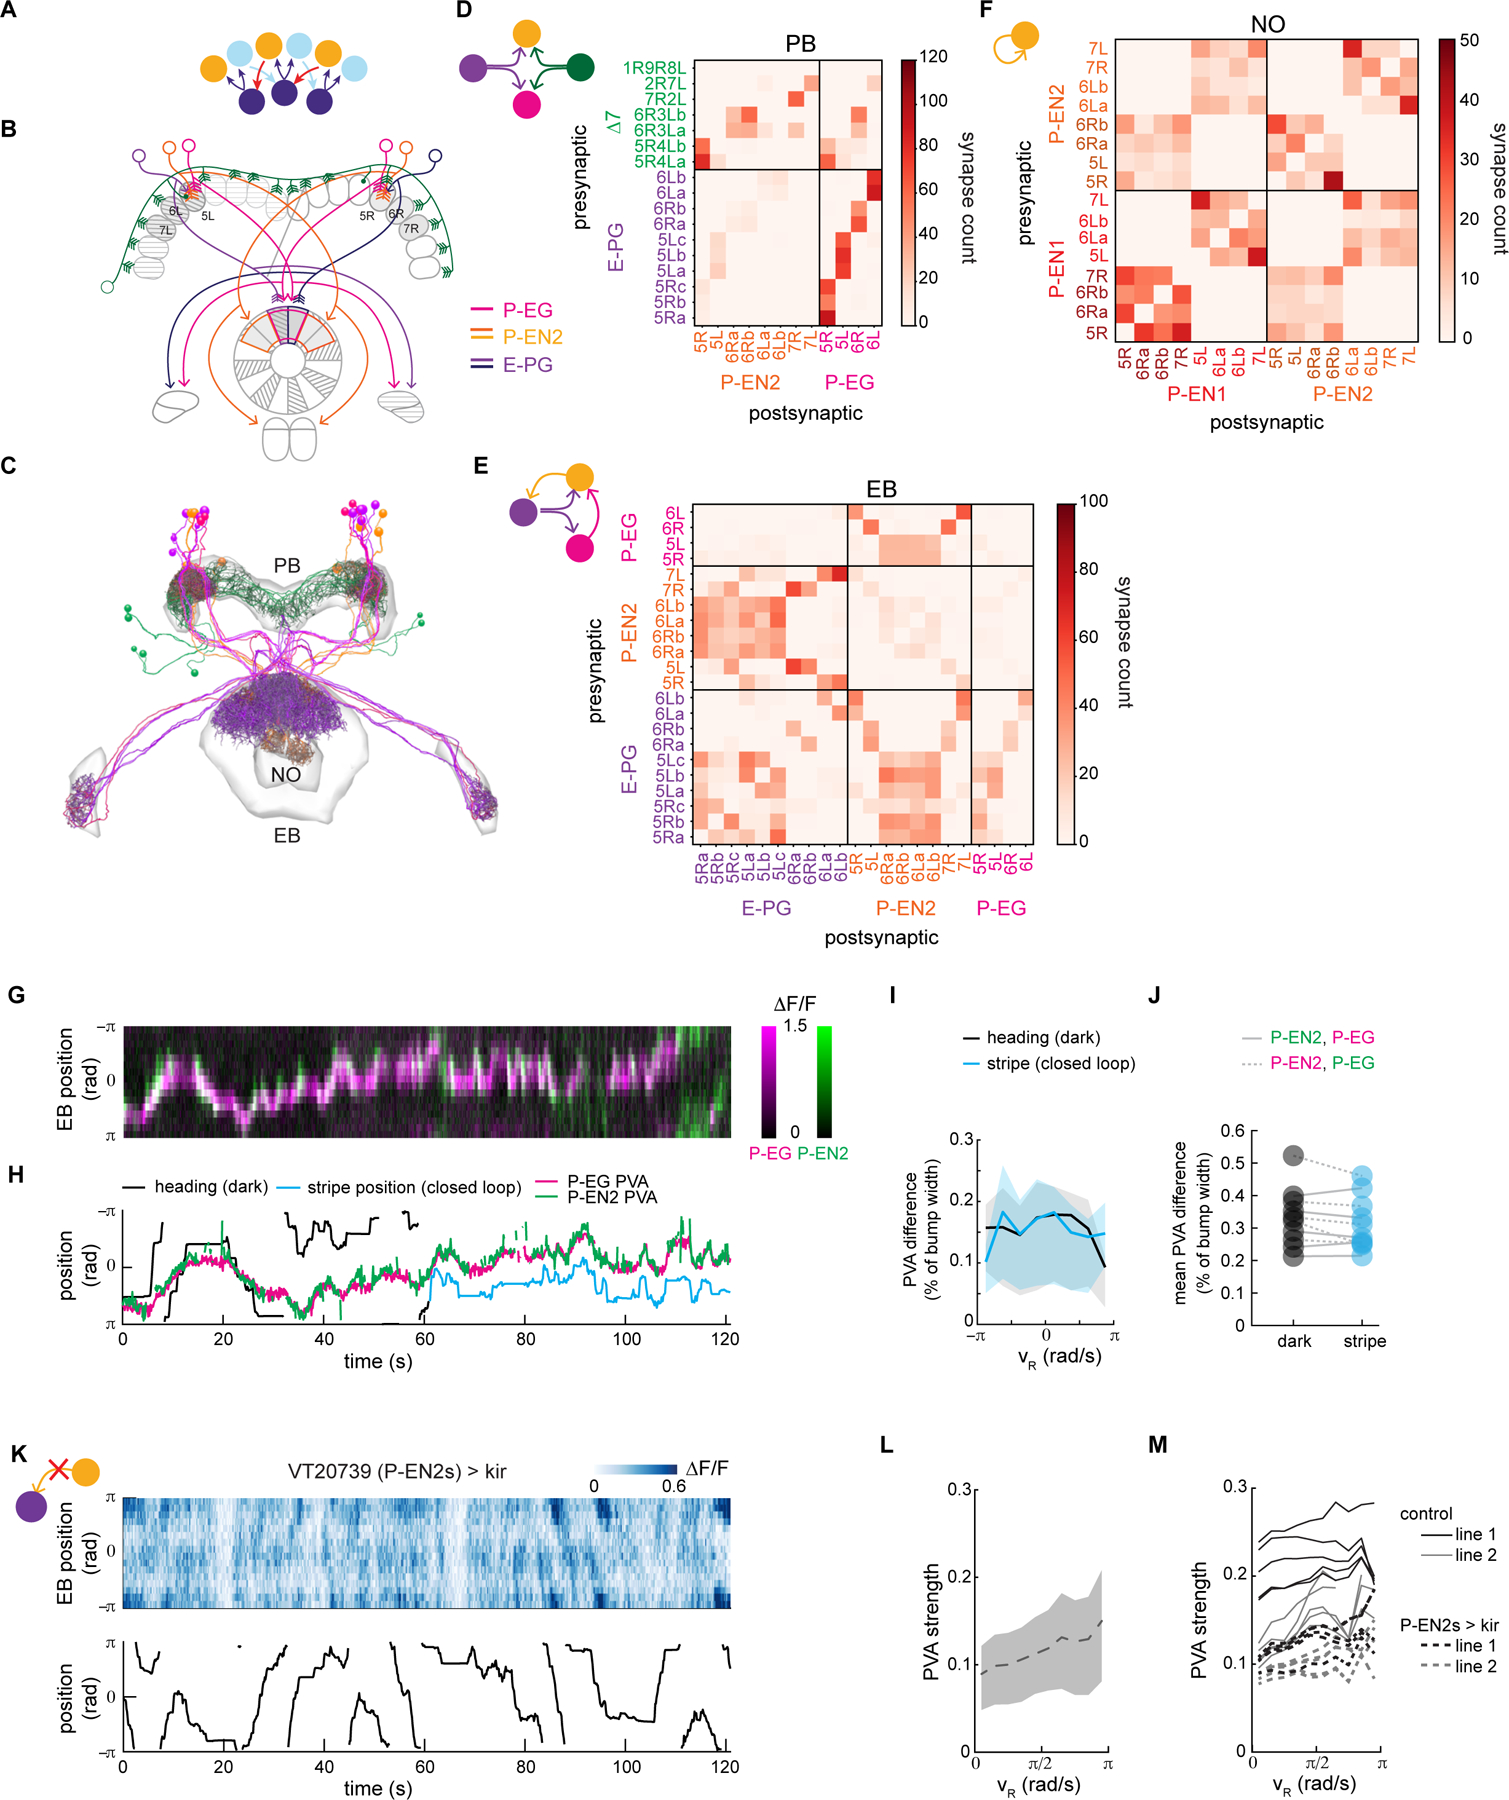
A. P-EN2 neurons (orange and light blue), like P-EN1s (Figure 4), conjointly encode the fly’s heading and angular velocity, creating an angularly shifted recurrent loop with E-PGs (purple).
B. Schematic of P-EG and P-EN2 arborizations in the central brain. EB wedges and PB glomeruli selected for E-PG, P-EG and P-EN2 reconstruction (Figure 6C) are in gray.
C. Reconstructed E-PG, P-EG, Δ7 and P-EN2 neurons. Synapses were labelled between these neurons in the NO and Gall and in selected parts of the EB and PB (Figure 6B).
D. Connectivity matrix between the E-PGs and Δ7s and the P-EN2s and P-EGs in the PB. The E-PGs form a large number of synapses onto the P-EGs (lower right quadrant).
E. Connectivity matrix between the E-PGs, P-EN2s, and P-EGs in the EB. The P-EGs only synapse onto the P-EN2s (top middle).
F. Connectivity matrix between the P-EN2s and P-EN1s in the NO. Note that the P-EN 1s and P-EN2s are interconnected in each nodulus.
G. Two color calcium imaging of P-EG (magenta, labeled with jRGECO1a) and P-EN2 (green, labeled with GCaMP6f) activity in the EB for a fly in the dark.
H. The PVAs of P-EG and P-EN2 bumps of activity are shown along with the fly’s heading in the dark (black trace) and the closed-loop stripe position when visible (blue trace).
I. Mean PVA difference across rotational velocities for the fly shown in Figure 7G, 7H. The upper and lower quartile range is shown in the shaded region.
J. Mean PVA difference across all velocities across flies in the dark or with a closed-loop stripe.
K. (top) Calcium activity in the E-PGs in the EB for a fly in the dark when the P-EN2 neurons express Kir. (bottom) The fly’s heading over the duration of the trial.
L. The mean PVA strength of the calcium activity in the EB as a function of the fly’s rotational velocity for the fly shown in H. The standard deviation is shown in the shaded region.
M. The PVA strength for 10 flies (5 for each genetic line) expressing Kir in the P-EN2s (dotted lines) relative to the control flies (solid lines) as a function of the fly’s rotational velocity.