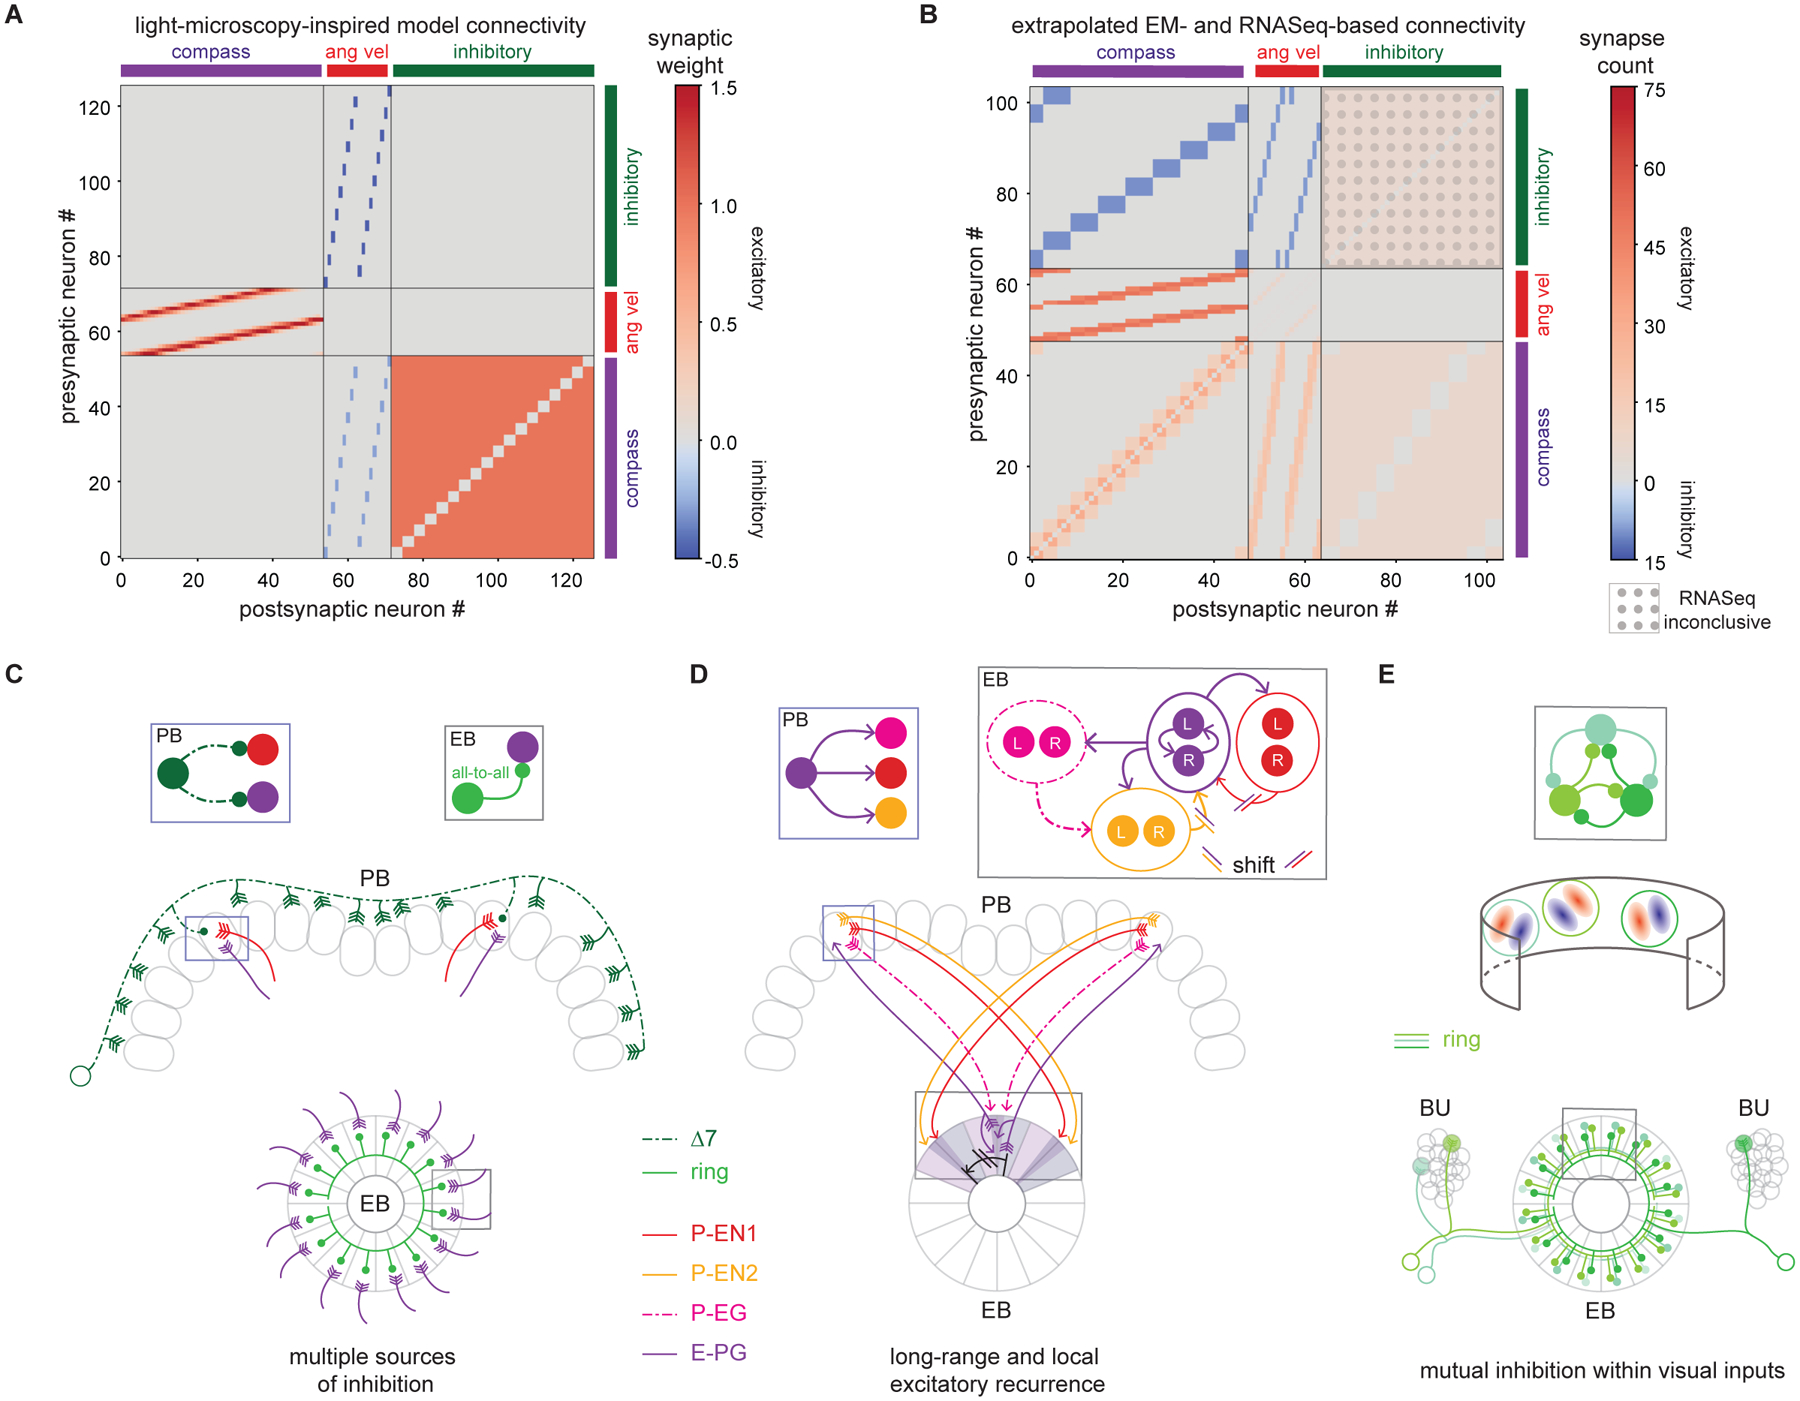
Figure 8: The fly ring attractor network is broadly consistent with theory, but also features unpredicted components and motifs.

A. Weight matrix for previous theoretical ring attractor model (Turner-Evans et al., 2017) for the fly compass (see STAR Methods).
B. Connectivity matrix extrapolated from data presented in this work. The synapse counts from the EB and PB are averaged and extrapolated to all untraced neurons of every class. Excitatory connections are shown in red and inhibitory connections are shown in blue.
C. Inhibition within the fly ring attractor appears to stem from multiple neuron classes, including the Δ7s and ring neurons. The Δ7s provide more structured, long-range inhibition of E-PG and P-EN neurons with different heading tuning in the PB (middle row; expanded view in box at top left), and different classes of ring neurons provide more uniform inhibition of E-PGs in the EB (bottom row; expanded view in box at top right).
D. Recurrent excitation between neurons with similar heading tuning (‘local excitation’ in the context of ring attractor models) takes many forms. E-PGs from a specific wedge in the EB synapse onto P-ENs and P-EGs in the PB (schematized in bottom row and expanded into box at upper left). P-ENs project back onto the E-PGs in the EB synapsing onto E-PGs from neighboring tiles (shift shown in bottom row; expanded view in box at upper right). P-EGs also project back without a shift to the EB, where they synapse onto the P-EN2s (upper right). E-PGs also synapse onto P-ENs within the EB (upper right).
E. Visual input neurons (simplified receptive fields indicated by red excitatory and blue inhibitory subfields in middle row) synapse onto one another in the EB (bottom row; expanded view in box at top). This mutual inhibition between visually responsive ring neurons may enable winner-take-all dynamics between visual cues, and/or gain control that maintains the same level of inhibition in the circuit in the presence of single or multiple visual cues.
