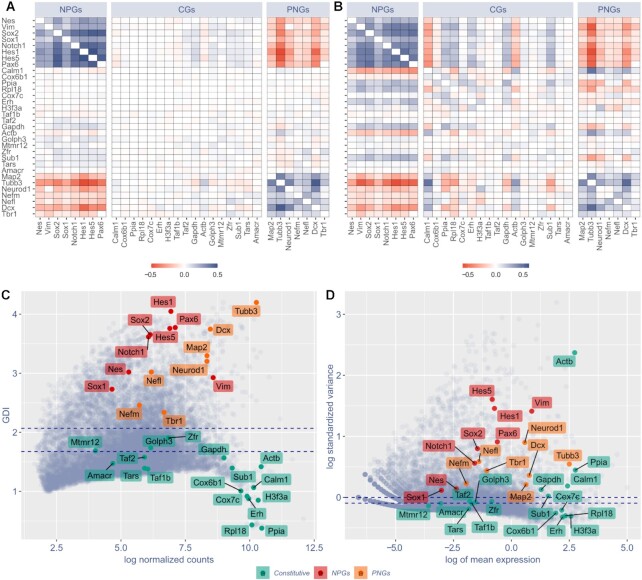
Figure 2.
GPA and GDI are able to discriminate constitutive genes (CGs) from neural progenitor genes (NPGs) and pan-neuronal genes (PNGs). (A) COTAN GPA of selected genes. Cell color encodes COEX index: blue indicates genes showing joint expression, red indicates genes showing disjoint expression. White indicates independence, meaning that one or both genes are constitutive, or that the statistical power is too low to detect co-expression. Since the co-expression of a gene with itself is irrelevant, the diagonal is made artificially white. (B) Pearson correlation matrix of the same selected genes as in (A), using Seurat (34) normalized expression levels (obtained following the website vignettes – Guided Clustering Tutorial). (C, D) Comparison between COTAN global differentiation index (GDI, C) and Seurat highly variable features (D) analysis. Red labels indicate NPGs, orange labels PNGs, green labels CGs. Dotted blue lines correspond to the median (lowest) and the third quartile (highest). All plots refer to E16.5 mouse hippocampal cells (25) and genes are selected to be characteristic of NPGs, PNGs and constitutive genes with both high and low typical expression.

