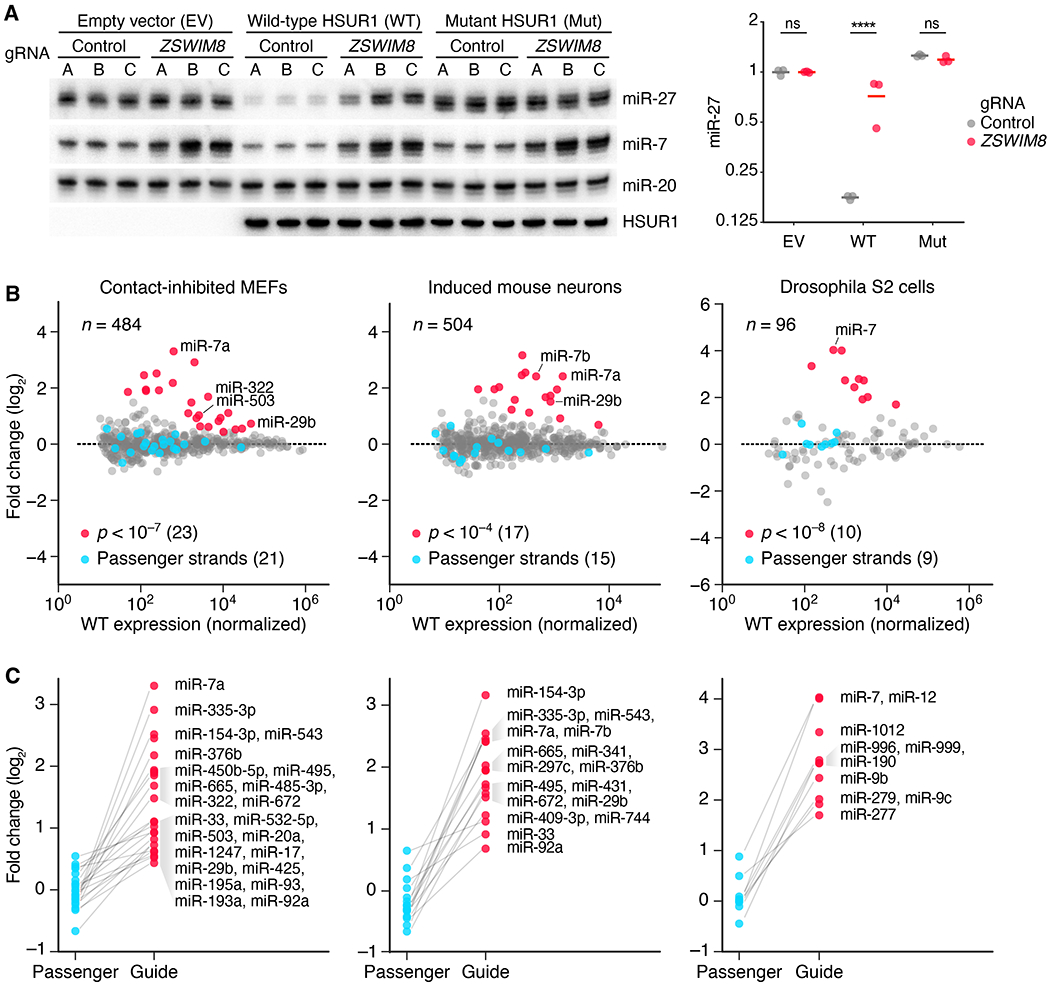
Fig. 3. ZSWIM8 is generally required for TDMD and limits accumulation of many miRNAs in diverse species.

(A) The requirement of ZSWIM8 for HSUR1-directed miR-27a degradation. The RNA blot measures levels of the indicated RNAs in BJAB cells stably expressing either HSUR1, mutant HSUR1, or empty vector—each also expressing Cas9 and either one of three control gRNAs (A–C) or one of three gRNAs targeting ZSWIM8 (A–C) for polyclonal knockout (table S1B). The plot shows relative levels of miR-27 after normalizing to that of miR-20 and then to the mean level of cells expressing empty vector (EV) and control gRNAs (means, horizontal lines; ****, p < 0.0001, two-way ANOVA followed by Bonferroni’s multiple-comparisons test). (B) The influence of ZSWIM8 on miRNA levels in cells from diverse species, as measured by sRNA-seq. Plotted are fold changes in miRNA levels observed upon polyclonal knockout of Zswim8 in MEFs and induced mouse neurons, and clonal knockout of the Zswim8 ortholog in Drosophila S2 cells (table S1). miRNA fold changes with significance exceeding the indicated p-value threshold are red, and fold changes for their corresponding passenger strands are blue. miR-29b in MEFs and miR-7a in induced neurons each had two quantifiable passenger strands, whereas some other miRNAs did not have a passenger strand that exceeded our threshold for accurate quantification (Data S2). Adjusted p values were determined by DESeq2. n = 3, 2, and 3 biological replicates for MEFs, induced mouse neurons, and S2 cells, respectively. Each replicate was performed with independent knockout and control lines (table S1A). (C) The asymmetric influence of ZSWIM8 on miRNA guide and passenger strands. Shown are the miRNA fold changes highlighted in (B), each paired with the fold change of its passenger strand(s). Unpaired points correspond to miRNAs for which passenger strands did not exceed the threshold for reliable quantification.
