
FIGURE 1.
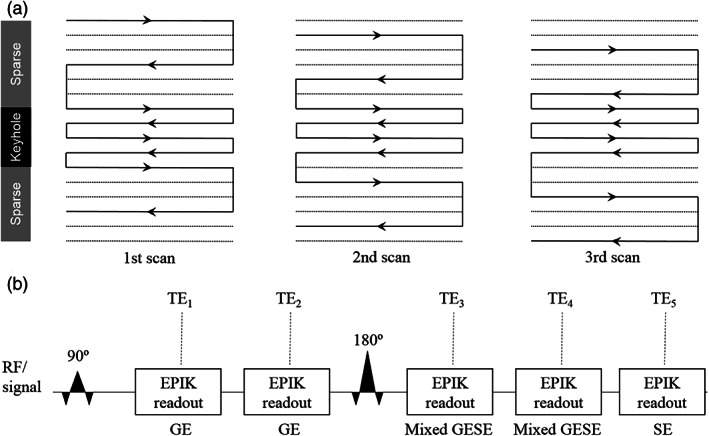
(a) A schematic depiction of the 3‐shot EPIK k‐space trajectory used as a basis for further development. The solid and dotted lines indicate the k‐space line positions to sample or skip, respectively, at each temporal scan. The lines in the keyhole region are sampled in every measurement. (b) Schematic sequence representation for GESE‐EPIK with five echoes: Two with GEs, two with mixed GESE and one with SE