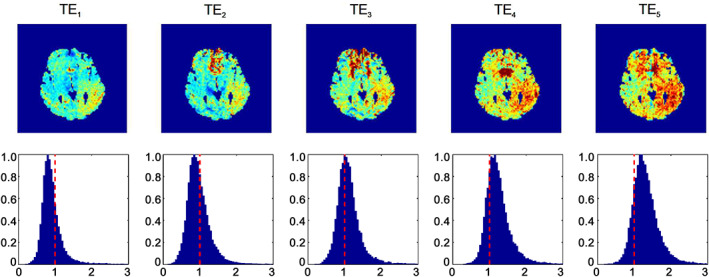
FIGURE 3.

Illustration of the tSNR ratio of EPIK and EPI. From left to right: The echo number increases from 1 to 5, whereby the last echo is a spin echo. On the top row, the tSNR ratio for a representative slice is shown and on the bottom row, the tSNR ratio histogram for the whole brain is depicted
