
FIGURE 5.
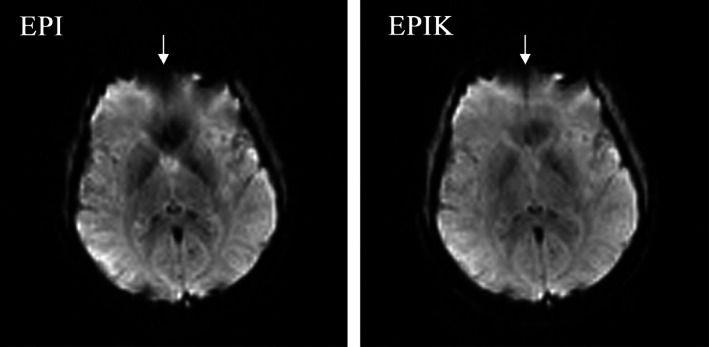
Reconstructed image from (a) EPI and (b) EPIK. The selected slice depicts the performance of EPIK in the reduction of susceptibility artefacts. The differences are marked with the white arrows
Official websites use .gov
A
.gov website belongs to an official
government organization in the United States.
Secure .gov websites use HTTPS
A lock (
) or https:// means you've safely
connected to the .gov website. Share sensitive
information only on official, secure websites.
Reconstructed image from (a) EPI and (b) EPIK. The selected slice depicts the performance of EPIK in the reduction of susceptibility artefacts. The differences are marked with the white arrows