
FIGURE 6.
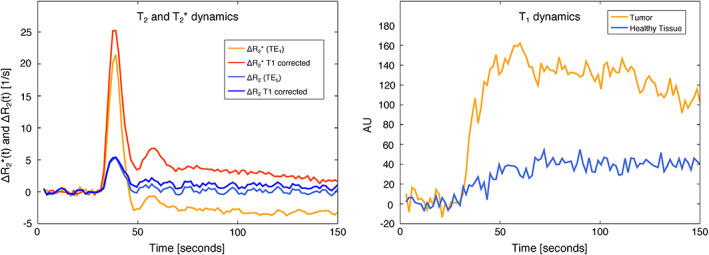
Left: the T 2*‐ and T 2‐weighted time course data with and without T 1 correction are depicted. Right: The T 1‐weighted time course is presented
Official websites use .gov
A
.gov website belongs to an official
government organization in the United States.
Secure .gov websites use HTTPS
A lock (
) or https:// means you've safely
connected to the .gov website. Share sensitive
information only on official, secure websites.
Left: the T 2*‐ and T 2‐weighted time course data with and without T 1 correction are depicted. Right: The T 1‐weighted time course is presented