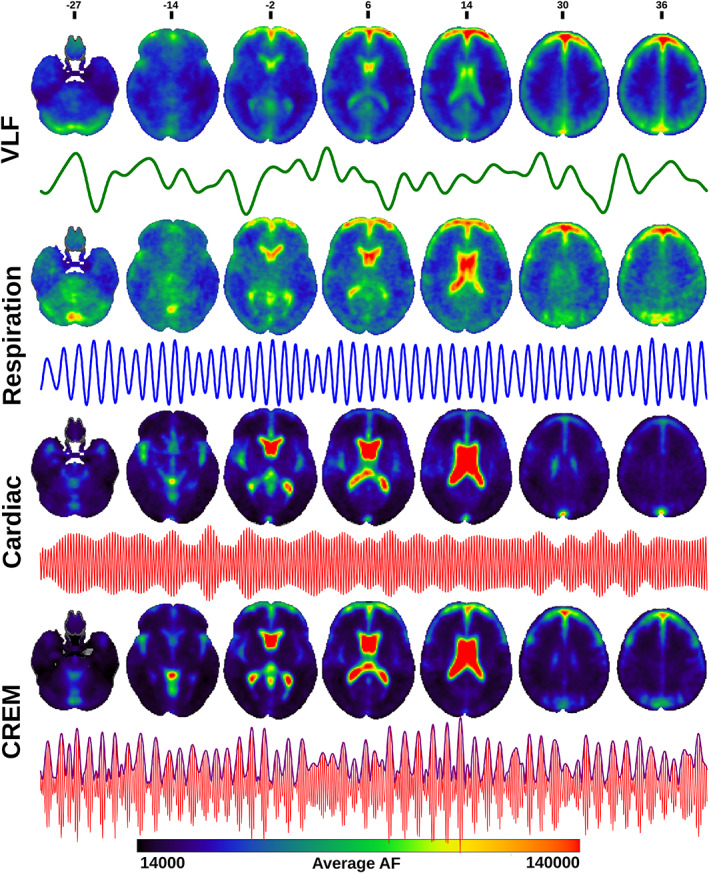
FIGURE 3.

Amplitude fluctuation (AF) images: Group averages of AF maps in the four different bands: very low frequency (VLF), respiration, cardiac and cardiorespiratory envelope modulation (CREM), and 5‐min representative time‐series signals from the anterior right cerebral white matter (VLF), right lateral ventricle (Respiration and cardiac), and posterior left cerebral white matter (CREM) for each band of a representative individual subject: VLF (green), respiration (blue), cardiac (red) and CREM (purple). Color bar indicates the AF range of all group average maps
